
Fig. 3.
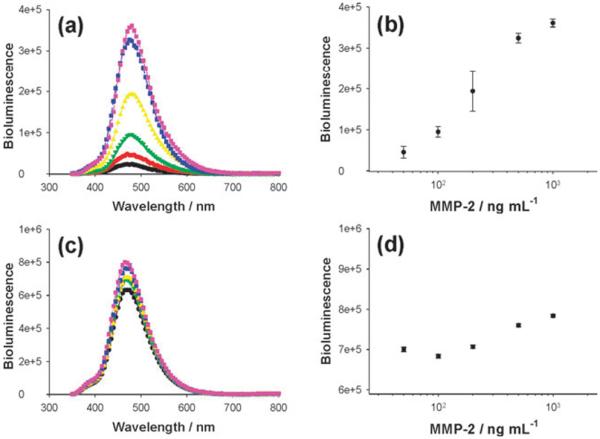
Detection of protease activity by using different Luc8-pep-Au NP conjugates: click and intein-based conjugate (a and b) and randomly coupled conjugate (c and d). Left graphs represent bioluminescence signals with different MMP-2 enzyme concentrations (0, 50, 100, 200, 500, and 1000 ng mL−1, from bottom to top), and the correlation between peak intensity and enzyme concentration is displayed in right graphs.