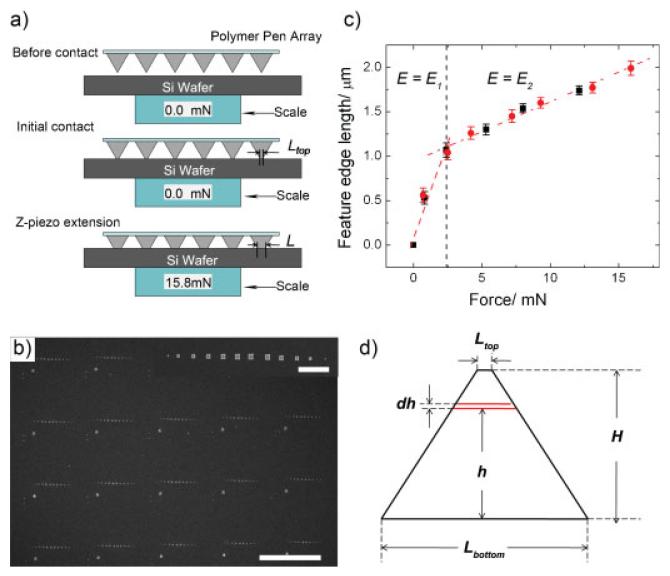
Figure 1.
a) Measurement of force during PPL writing. b) SEM images of Au features produced undervarying forces (0.7, 2.5, 4.2, 7.2, 9.3, 13.1, 15.9, 12.1, 8.0, 5.3, 2.4, 0.8, 0 mN, left to right) generated by a PPL array with ≈8000 pens. The scale bar is 80 μm. The inset is a SEM of a pattern generated from a singlepolymerpen, and the scalebar is 10 μm.c) The plot of feature edge length as a function of force between the tip and the surface. Red dots are features produced as the force is increasing and the black squares indicate features created as force is decreasing. The red dashed lines are linear fits to the data (R > 0.98 for both lines). d) Geometric model of the tip.

