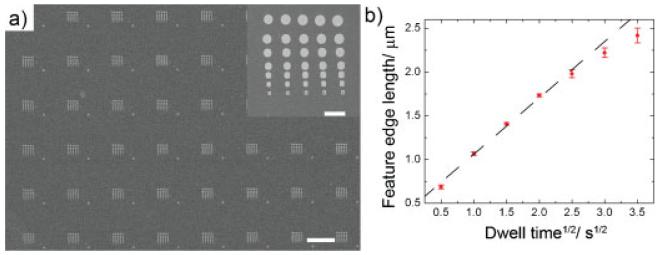
Figure 2.
a) SEM image showing Au patterns generated by varying the dwell time of the tips on the surface (0.25, 1, 2.25, 4, 6.25, 9, and 12.25 s). The scale bar is 50 μm. The inset shows features generated by a single pen and the scale bar is 5 μm. b) A plot of the feature size as a function of (dwell time)1/2 has the same linear relationship characteristic of DPN. The dashed black line indicates the linear fit (R = 0.99).

