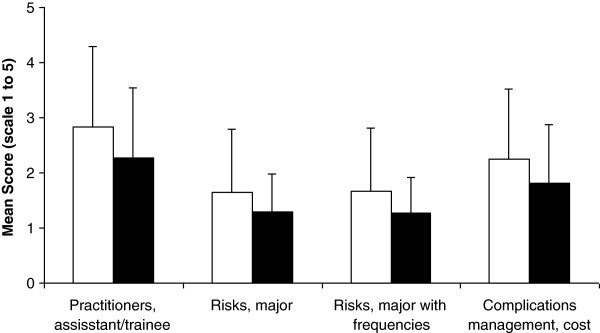
Figure 3.

Comparison of norm perception of information disclosure between pre-procedure (open bars) and post-procedure patients (black bars). Data represent mean and SD. Only information items with significant differences are included (p value for Mann–Whitney test ranged from <0.001 to 0.001). For full description of items, see text and Additional file 1.
