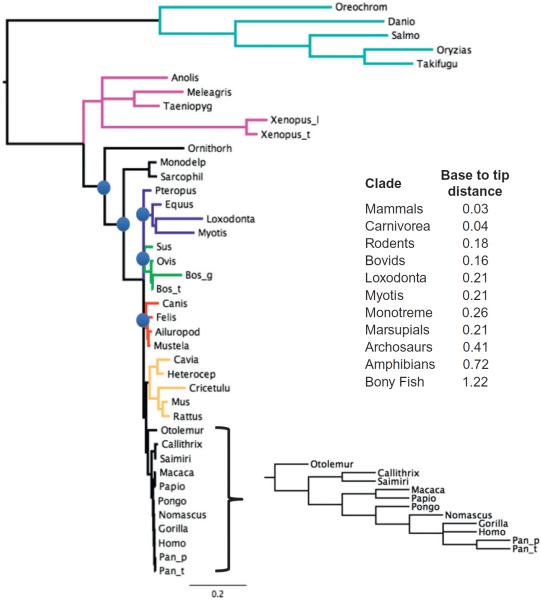
Figure 1.2.
A Bayesian phylogenetic tree showing the relationships of vertebrate AEG-1/MTDH/LYRIC genes. The model used in the analysis was a GTR with invariants gamma. One million generations were run, upon which convergence of chains was assessed to be adequate. The tree is the result of removing a burn-in of 20%. All nodes in the tree except for those marked by blue circles have posterior probabilities of 0.99 or better. The nodes marked by blue circles had posterior probabilities between 0.5 and 0.8, suggesting that these nodes are not particularly robust. The different colored branches in the tree indicate well established taxonomic groups except for the dark blue which contains elephants and bats and horse. The more conventionally accepted groups are as follows: light blue, bony fish; purple, archosaurs and amphibians; light green, bovids and close relatives; red, carnivores; orange, rodents; black, primates. The inset table shows the base to tip distance of the indicated groups in the tree.

