
Fig 7.
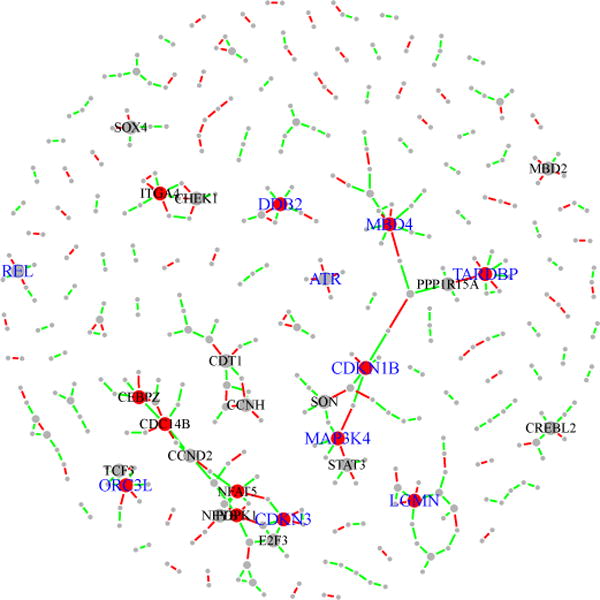
Inferred networks at FDR=0.2 from the BC expression data. A total of 338 edges (selection frequencies ≥ 0.85) are identified. Among these 338 edges, those with selection frequencies ≥ 0.98 (corresponding to the set with FDR= 0.05) are colored in red while other edges are colored in green. Genes with degree> 3 are labeled by their symbols; genes with degree> 4 are indicated by red nodes. In addition, the top ten genes with consistently high connection across perturbed datasets are labeled in blue symbols.