Figure 5.
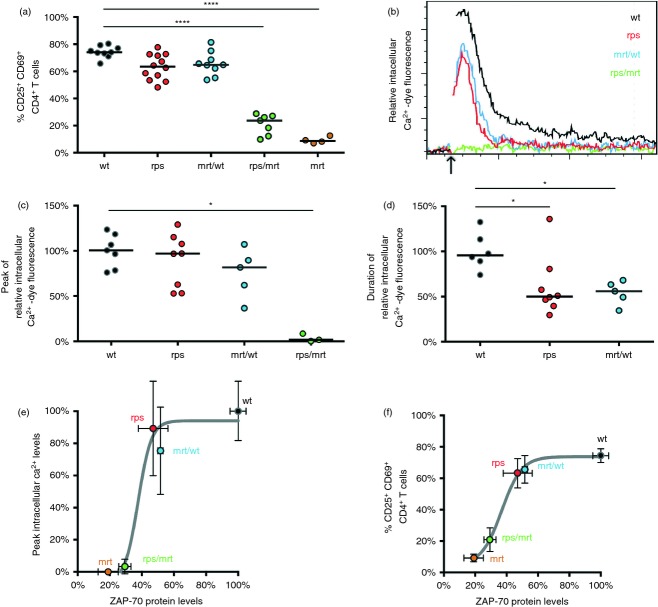
Reduced Zap70 protein levels in Zap70rps CD4+ and CD8+ T cells leave T-cell receptor (TCR) signalling above the critical threshold for activity. (a) Splenocytes from wild-type, Zap70rps, Zap70mrt/wt, Zap70rps/mrt and Zap70mrt mice were stimulated for 24 hr with anti-CD3 and anti-CD28 before measurement of activation via CD25 and CD69 up-regulation in CD4+ T cells (n = 9, 12, 9, 7, 4 mice/group, median and individual values shown). (b) CD4+ splenocytes from wild-type, Zap70rps, Zap70mrt/wt,and Zap70rps/mrt mice were loaded with Ca2+-dependent dye and assessed by flow cytometry for intracellular Ca2+. The arrow indicates the addition of streptavidin to cause the cross-linking of CD3 and CD4. Representative histograms are shown gated on CD4+ T cells. n = 7, 8, 5, 3 mice/group (c) Relative peak intracellular Ca2+-dependent dye fluorescence (median and individual values shown) and (d) duration of elevated intracellular Ca2+-dependent dye fluorescence in the cells described in (b) (median and individual values shown). (e, f) Relationship between Zap70 protein levels (relative to wild-type T cells based on data in Fig. 4e) and (e) peak intracellular Ca2+ levels following TCR stimulation (relative to wild-type T cells based on data in part c of this figure) or (f) activation (as depicted in panel a of this figure) in wild-type, Zap70rps, Zap70mrt/wt, Zap70rps/mrt and Zap70mrt mice for CD4+ splenocytes. Mean and standard deviation for each genotype is shown, with the Boltzmann sigmoidal function of best fit. *P < 0·05; ****P < 0·0001.

