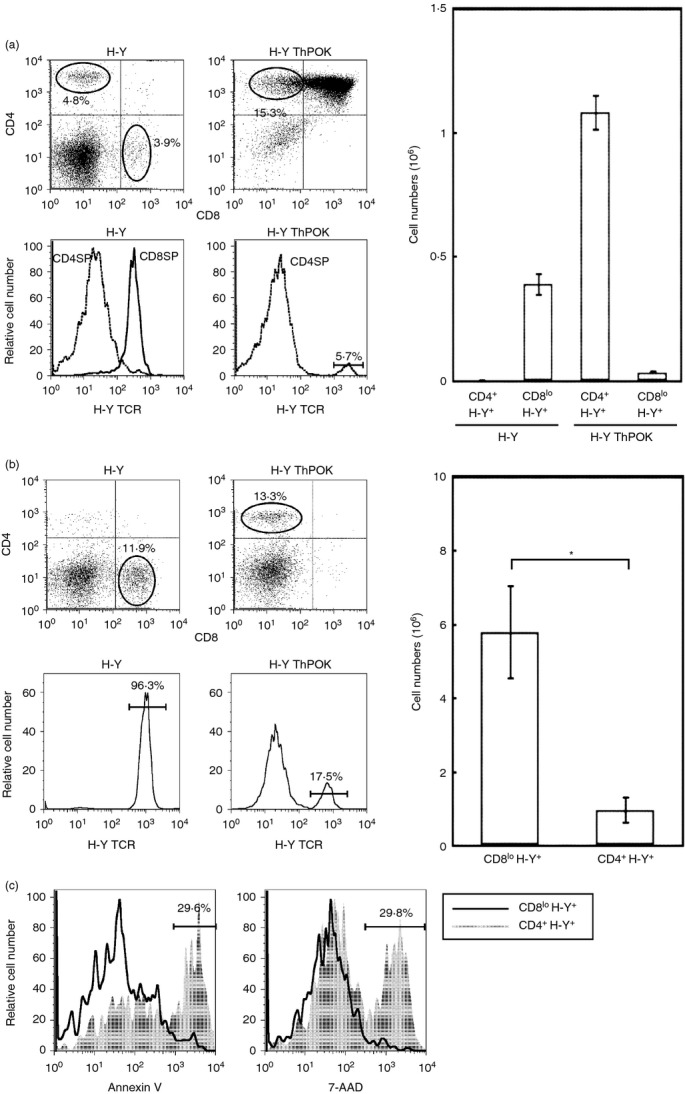
Figure 1.

The ThPOK transgene converts CD8lo cells into CD4+ CD8− cells. (a) The dot plots depict CD4 and CD8 profiles of thymus from male H-Y TCR and H-Y ThPOK transgenic mice. The circles in the dot plots indicate the gates for CD8SP or CD4SP cells. The histograms depict the expression of H-Y TCR by gated CD8SP or CD4SP cells from H-Y TCR and H-Y ThPOK transgenic mice, respectively. The numbers in the dot plots and histograms indicate the percentages of gated cells. The bar graphs depict the mean numbers of the indicated cell types recovered from male H-Y and H-Y ThPOK mice. (b) The dot plots depict CD4 and CD8 profiles of lymph node cells from male H-Y TCR and H-Y ThPOK transgenic mice. The circles in the dot plots indicate the gates for CD8lo or CD4+ cells. The histograms depict the expression of H-Y TCR by gated CD8lo or CD4+ cells from H-Y TCR and H-Y ThPOK transgenic mice, respectively. The * indicates P < 0·05; two-tailed t-test. (c) The histograms depict levels of annexin V and 7-AAD staining by gated CD8lo H-Y TCR+ and CD4+ H-Y TCR+ cells from male H-Y TCR and H-Y ThPOK transgenic mice, respectively. Results are representative of three separate experiments.
