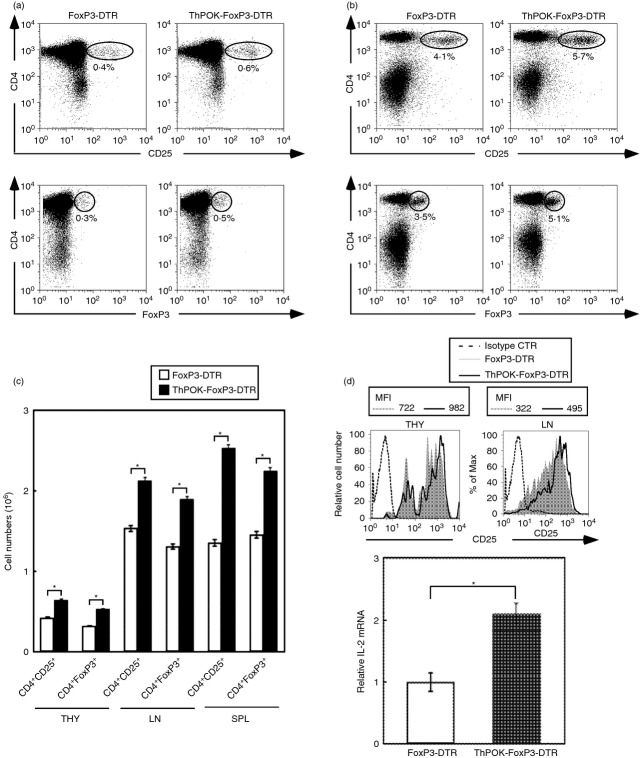
Figure 5.
Increased recovery of CD4+ FoxP3+ T cells from ThPOK transgenic mice. The dot plots depict the expression of CD4 and CD25 (upper row) and CD4 and FoxP3 (lower row) by thymocytes (a) and lymph node cells (b) from FoxP3-DTR and ThPOK-FoxP3-DTR mice. The numbers in the dot plots indicate percentages of the indicated populations. (c) The bar graphs depict the mean numbers ± SD of CD4+ CD25+ and CD4+ FoxP3+ T cells recovered from the thymus, lymph nodes and spleens of FoxP3-DTR and ThPOK-FoxP3-DTR transgenic mice. The * indicates P < 0·05; two-tailed t-test. (d) The histograms indicate expression of CD25 by CD4+ FoxP3+ cells of thymus and lymph nodes from FoxP3-DTR and ThPOK-FoxP3-DTR transgenic mice. The mean fluorescence intensities of CD25 expressed by thmocytes and lymph node cells from FoxP3-DTR or ThPOK-FoxP3-DTR mice are indicated. The bar graphs depict the relative interleukin-2 (IL-2) transcripts of PMA + ionomycin-activated CD4+ FoxP3+ T cells of lymph nodes from FoxP3-DTR and ThPOK-FoxP3-DTR transgenic mice. The rat IgG2 isotype control antibodies were used as indicated. The * indicates P < 0·05; two-tailed t-test. Results are representative of three experiments.

