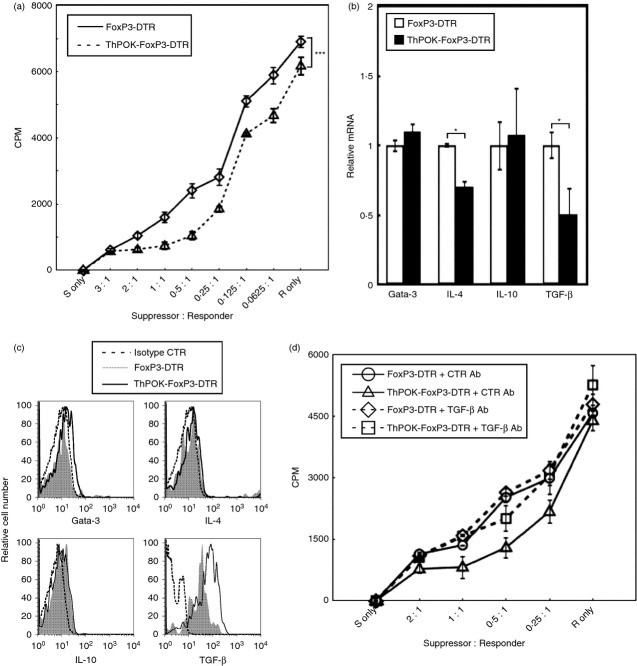
Figure 6.
The CD4+ FoxP3+ regulatory T (Treg) cells from ThPOK transgenic mice expressed higher transforming growth factor-β (TGF-β) -dependent suppressor activity. (a) Sorted CD4+ FoxP3+ cells from FoxP3-DTR and ThPOK-FoxP3-DTR mice were cultured with sorted CD4+ FoxP3− cells from FoxP3-DTR mice and mitomycin C-treated antigen-presenting cells from B6 mice for 72 hr. [3H]Thymidine (1 μCi per well) was added to the cultures for the final 8 hr. The x-axis indicates the ratio of CD4+ FoxP3+ (suppressor) cells to CD4+ FoxP3− (responder) cells. Data points indicate mean [3H]thymidine incorporation of triplicate cultures. The *** indicates P < 0·001; paired t-test. Results are representative of three independent experiments. (b) The bar graphs represent the relative transcript level of Gata-3, interleukin-4 (IL-4), IL-10 and TGF-β expressed by activated CD4+ PoxP3+ cells from FoxP3-DTR and ThPOK-FoxP3-DTR transgenic mice by real-time PCR. Gene expression by activated CD4+ FoxP3+ cells from FoxP3-DTR mice was arbitrarily set to 1 for each gene. The values shown are the mean ± SD of triplicate assays. The * indicates P < 0·05; two-tailed t-test. Results are representative of three experiments. (c) The histograms depict the expression of the indicated cytokines by gated CD4+ FoxP3+ cells from FoxP3-DTR and ThPOK-FoxP3-DTR transgenic mice. The isotype control antibodies were used as indicated. Results are representative of three separate experiments. (d) Sorted CD4+ FoxP3+ cells from FoxP3-DTR and ThPOK-FoxP3-DTR mice were cultured with CD4+ FoxP3− cells and mitomycin C-treated antigen-presenting cells from for 72 hr with 4 μg/ml of either control or neutralizing anti-TGF-β antibodies. [3H]Thymidine was added to the cultures for the final 8 hr. Individual data points represent mean [3H]thymidine incorporation ± SD of triplicate cultures. Results are representative of three experiments.

