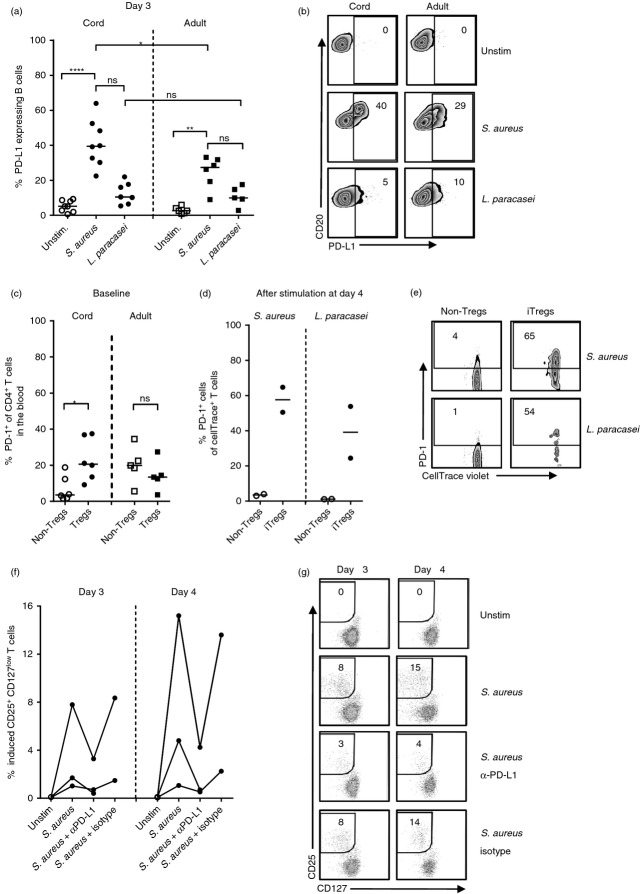
Figure 6.
Blocking programmed death 1 (PD-1)/ programmed death ligand 1 (PD-L1) interaction during Staphylococcus aureus stimulation reduces induction of neonatal FOXP3+ CD25+ CD127low T cells. (a and b) The proportion of PD-L1+ B cells after stimulation of mononuclear cells from cord blood and peripheral blood from adults with S. aureus or Lactobacillus paracasei for 3 days, illustrated in (a) a graph and (b) representative zebra plots. (c–e) The expression of PD-1 on (c) circulating non-regulatory T (non-Treg) cells and CD25+ CD127low T cells in newborns and adults and (d and e) S. aureus-stimulated non-Treg cells and S. aureus-induced Treg cells after 4 days of culture, illustrated in (c and d) graphs and (e) representative zebra plots. (f and g) The proportion of de novo generated CD25+ CD127low T cells within the CD4+ non-Treg cell population after stimulation with S. aureus in the presence or absence of α-PD-L1 (n = 3) or isotype control (n = 2) for 3–4 days, illustrated in (f) a graph and (g) representative zebra plots. Each symbol in the graphs represents one individual and horizontal bars indicate the median value. Numbers represent the percentage of cells within the gate. (Kruskal–Wallis test followed by Dunn's multiple comparison test was used to compare the proportions of PD-L1+ B cells among unstimulated control and stimulated cultures, Mann–Whitney U-test was used to compare the proportion of PD-L1+ B cells among cultures from cord and adult blood after S. aureus or L. paracasei stimulation, and Wilcoxon signed rank test was used to compare the expression of PD-1 on non-Treg cells and Treg cells). * P ≤ 0·05, ** P ≤ 0·01, ****P ≤ 0·0001.

