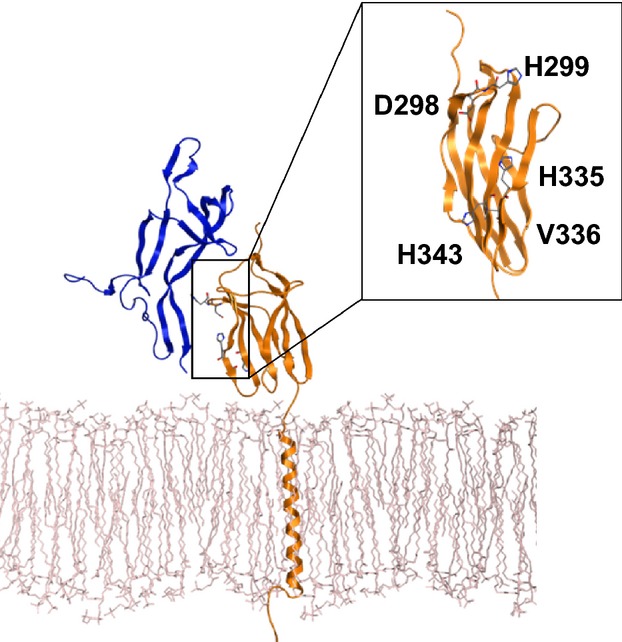
Figure 1.

Computational modeling of the specific binding between TrkB (yellow) and BDNF (blue) on the cell membrane (white). 3D structure of TrkB/BDNF on the cell membrane is shown. Inset indicates potential amino acid residues participating in the interaction.
