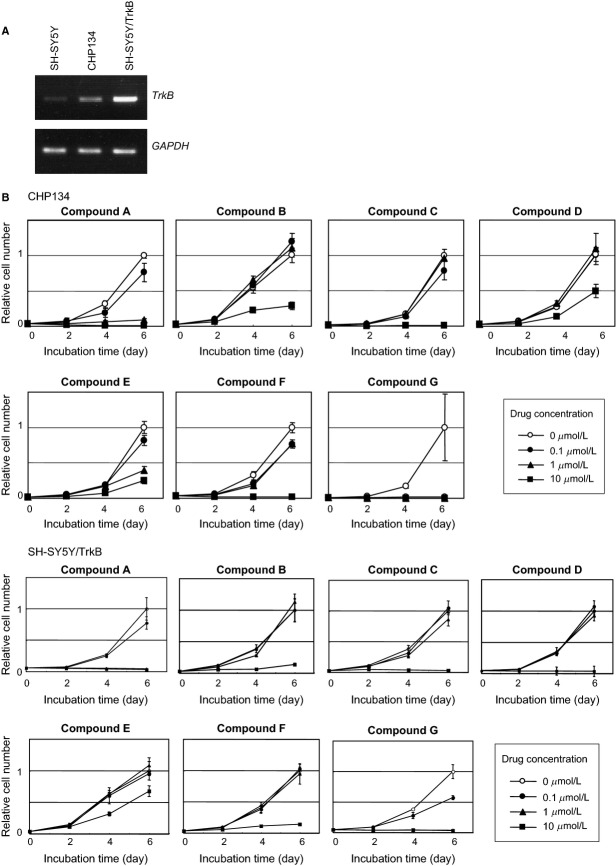
Figure 2.
Growth inhibitory effects of compounds A–G in neuroblastoma-derived cell lines. (A) Expression levels of TrkB mRNA in SH-SY5Y, SH-SY5Y/TrkB, and CHP134 cells. SH-SY5Y/TrkB is the cells in which TrkB is stably cloned. (B) Growth curves in the presence or absence of compounds A–G. Compounds concentration: open circle (0 μmol/L), filled circle (0.1 μmol/L), filled triangle (1 μmol/L), filled square (10 μmol/L). The cell numbers were represented as the relative values compared to those without the compounds (open circle) at the time of 6 days (set to 1). The P-values between the open circle (0 μmol/L) and filled square (10 μmol/L) at day 6 were less than 0.05 in all experiments using seven compounds.

