
Figure 7. Local field potential (LFP) changes in the periaqueductal grey (PAG) during rest, anticipation, exercise and recovery .
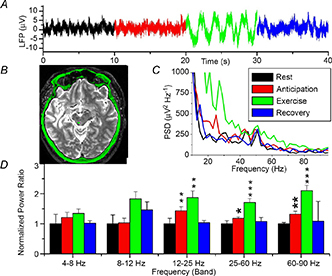
A, raw data trace. B, post‐operative magnetic resonance image showing a unilateral electrode in the left PAG (green dot). C, mean power spectral density (PSD) for all three patients (recovery not shown for clarity). D, normalized spectral changes (rest = 1.0) divided into frequency bands. *P < 0.05, **P < 0.01, ***P < 0.001. Note increase in neural activity during both anticipation of exercise and actual exercise. From Green et al. (2007) with permission.