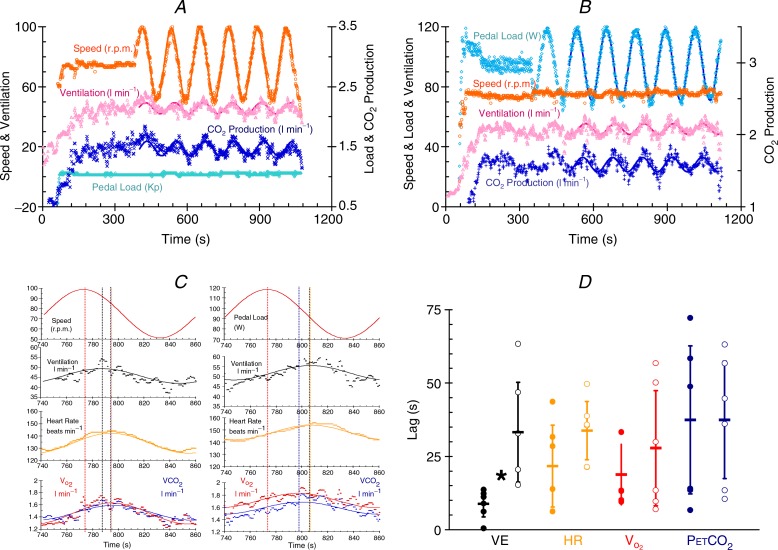
Figure 3.
A, breath-by-breath variables measured during an exercise test with the subject varying pedalling speed (cadence) while pedal loading remains constant (extract from a 2013 poster by Caterini et al. in Experimental Biology). The solid lines are fitted sine waves. B, breath-by-breath variables measured during an exercise test with varying pedal loading while pedalling speed (cadence) remains constant (extract as above). The solid lines are fitted sine waves. C, a single sine wave taken from the tests shown in A and B (extract as above). On the left, speed or cadence is changed sinusoidally while pedal loading is constant (top red trace), and on the right pedal loading is changed sinusoidally while cadence is constant (top red trace). The traces below show breath-by-breath ventilation (black symbols), heart rate (orange symbols), oxygen uptake (red symbols) and carbon dioxide production (blue symbols). The solid lines are the fitted sine waves and the vertical lines show the timing of the peaks of the fitted responses. D, sinusoidal exercise time lags. The time lag for ventilation (black symbols), heart rate (orange symbols) and oxygen consumption ( , red symbols) behind the sine wave variations in cadence at constant pedal loading (filled symbols) and the sine wave variations in pedal loading at constant cadence (open symbols) measured during the sine wave tests (extract as above). The means are indicated as horizontal bars and the standard deviations as vertical lines. *Significant difference.

