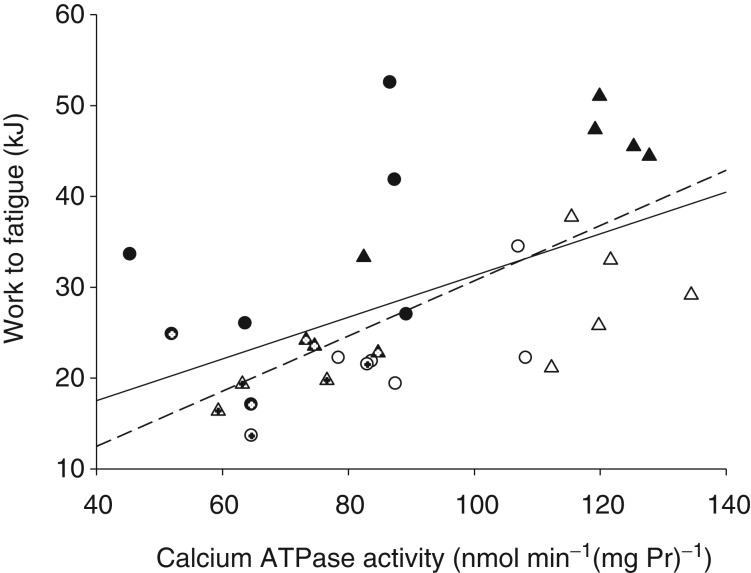
Figure 3.
Maximal in vitro calcium ATPase activity at rest and the amount of work performed to fatigue among the group with type 1 diabetes (T1D) before (open triangles) and after sprint training (filled triangles) and the non-diabetic control group (CON) before (open circles) and after sprint training (filled circles). The women in each group are indicated by cross-hairs within the symbols. Solid line, regression for all subjects, pooled data: r = 0.53, r2 = 0.28, P < 0.01. Dashed line, regression for the T1D group only: r = 0.70, r2 = 0.49, P = 0.002.

