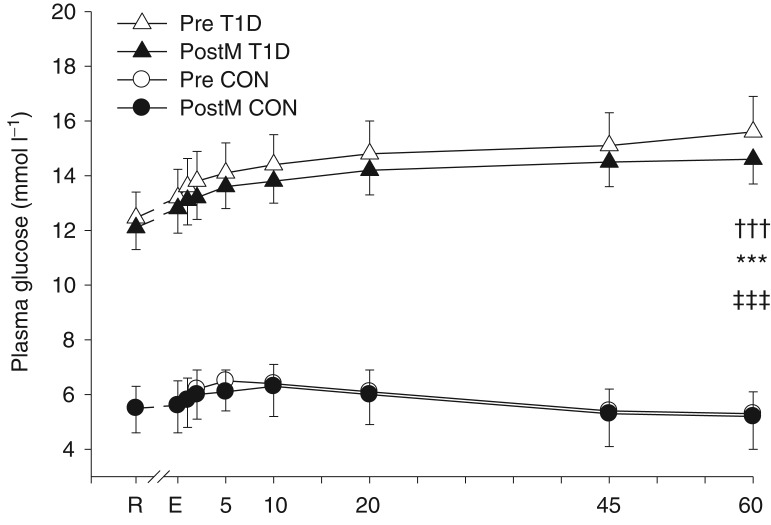
Figure 5.
Plasma glucose concentration (mean ± SEM) among the T1D (triangles; n = 8) and CON (circles; n = 8) groups before (open symbols) and after (filled symbols) sprint training at rest (R), immediately after intense exercise (E), and at 1, 2, 5, 10, 20, 45 and 60 min of recovery. ‡‡‡Main effect of group, T1D < CON, P < 0.0001; †††time × group interaction, T1D>CON at every time, P < 0.001; and ***main effect of time, P < 0.001.

