
Figure 4. PCA of 1H-NMR spectral data for albumin-treated patients on Day 7 compared to baseline samples taken before the first albumin or placebo treatment.
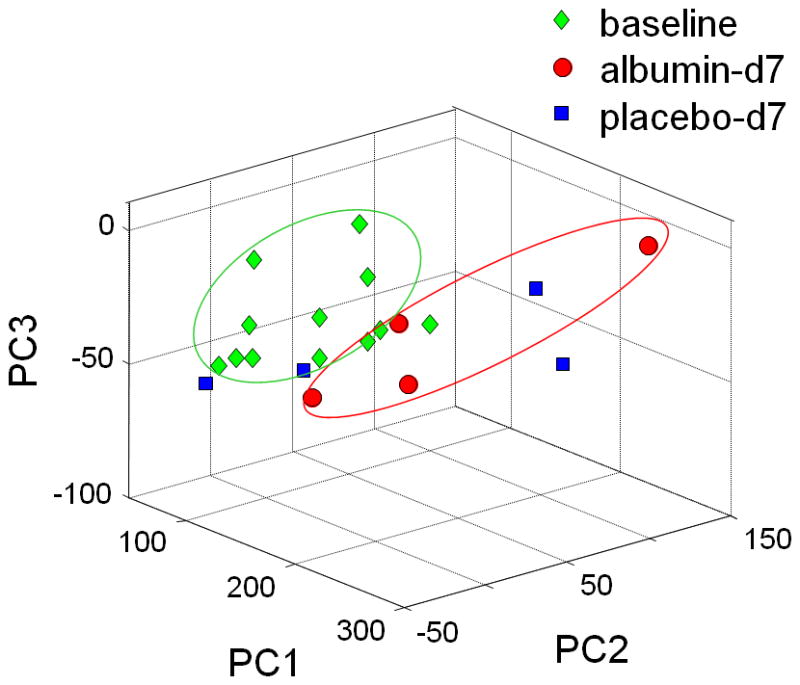
Samples were color coded green for baseline, blue for placebo and black for albumin on Day 7. Results showed that 3 days after last albumin treatment, metabolic differences showed a trend in patients receiving albumin. Corresponding plot for patients receiving placebo showed no separation. Data were analyzed with mean centered.