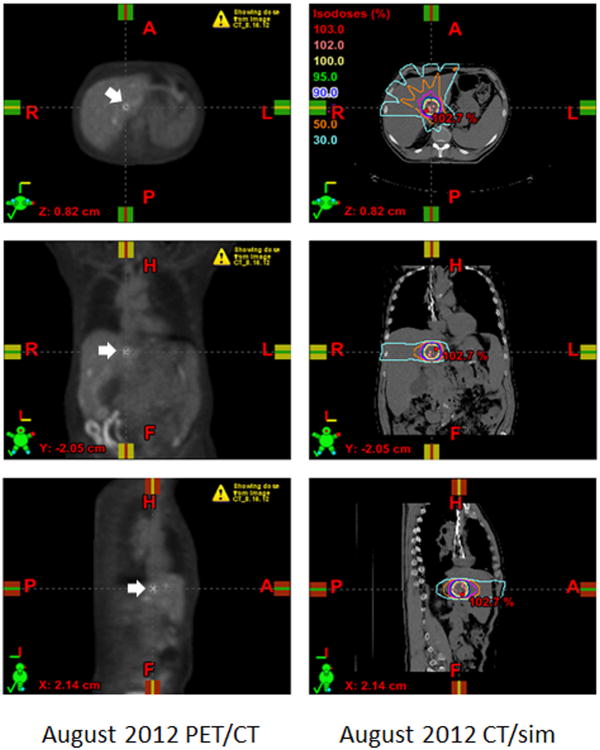
Figure 1. Registration of PET/CT and CT/simulation to target intrahepatic lesion.
The PET/CT from August 2012 (left panels) was imported into the Eclipse planning software (Varian Medical Systems, Inc., Palo Alto, California) and registered to the CT/simulation (right panels) that was acquired prior to treatment. Select axial (top panels), coronal (middle panels), and sagittal (bottom panels) images are displayed. The most hypermetabolic liver lesion was selected as the GTV (white arrows, left panels). The treatment plan was designed with 6-MV photons by means of a coplanar 5-field intensity-modulated technique to encompass the GTV with a 1 cm margin (right panels). The treatment was prescribed to the 100% isodose line to a total dose of 30 Gy distributed over 5 fractions. The isodose lines represent total doses of 30 Gy (yellow), 15 Gy (orange), and 9 Gy (light blue) (right panels).

