
Fig. 1.
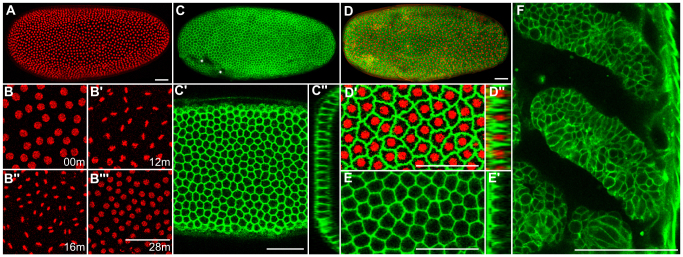
Fluorescence labeling of Tribolium embryos with nuclear, membrane and actin markers. (A) Average intensity projection of a uniform blastoderm labeled with H2B-RFP. (B-B′′) Time series of H2B-RFP-labeled chromatin (B) before, (B′,B′) during and (B′′) after the synchronous 12th mitotic division. Single optical slices are shown timed against B. (C-C′) Uniform blastoderm labeled with GAP43-YFP. (C) Average intensity projection of the entire embryo, (C′) single optical slice and (C′) transverse section that shows labeling of the entire membrane surface. Asterisks in C denote blemishes on the vitelline membrane that locally impair fluorescent signal. (D-D′) Embryo at the uniform blastoderm stage with H2B-RFP-labeled nuclei and GAP43-YFP-labeled membranes. (D) Average intensity projection, (D′) optical slice and (D′) transverse section. (E,E′) Uniform blastoderm labeled with LA-GFP. (E) Single optical slice and (E′) transverse section showing cortical actin fluorescence around the apical surface. (F) Single optical slice through two developing thoracic limbs and the pleuropod of an embryo 48 hours after injection with GAP43-YFP mRNA. Anterior is towards the left in most panels, except in cross-sections C′,D′,E′, where apical is towards the left, and in F, where the ventral midline is towards the left and anterior is towards the top. Scale bars: 50 μm.