
Fig. 3.
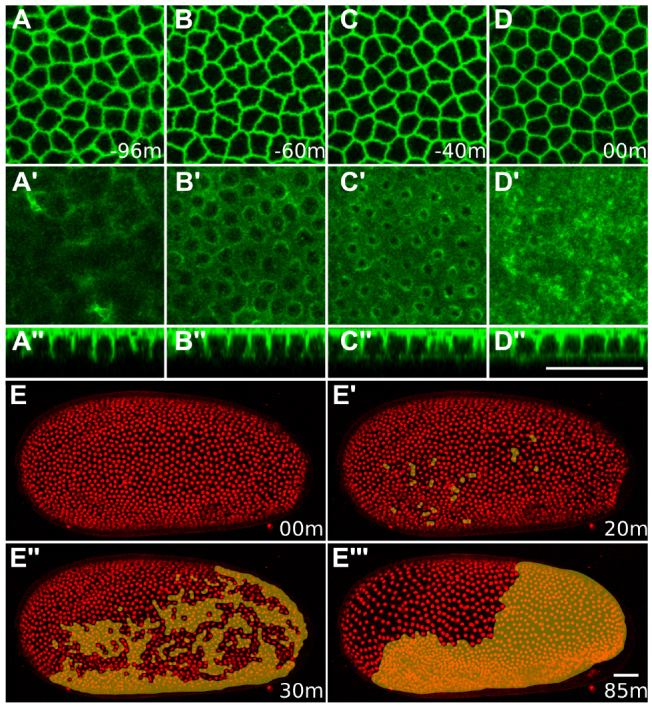
Tribolium blastoderm cellularization and differentiation. (A-D′) Time series of blastoderm cellularization during 13th interphase of a GAP43-YFP-labeled embryo timed against basal cell closure shown in D-D′. (A-D) Subapical optical sections showing progressive refinement of the polygonal packing geometry during blastoderm cellularization. (A′-D′) Basal optical sections showing progressive membrane constriction and eventual basal cell closure. (A′-D′) Cross-sections showing the lateral extension of constricting basal membranes during cellularization. (E-E′′) Time series of the 13th round of cell divisions during blastoderm differentiation. All panels show average intensity projections of an H2B-RFP-labeled embryo (lateral views, anterior towards the left and dorsal towards the top) at different stages timed against E. Divided nuclei in the embryonic rudiment are indicated with an orange mask. (E) Labeled nuclei have uniform size and distribution before the onset of 13th divisions. (E′,E′) Asynchronous nuclear divisions are detected throughout the embryonic rudiment, but not in the serosa primordium. (E′′) Divided nuclei in the embryonic rudiment become smaller and more tightly packed compared with non-dividing serosa nuclei that increase their spacing. Scale bars: 50 μm.