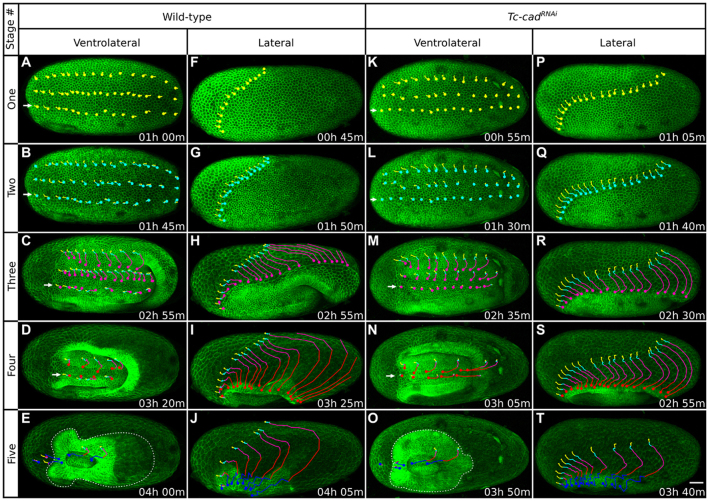
Fig. 4.
Patterns of cell movement during Tribolium embryogenesis in wild-type and Tc-cadRNAi embryos. Each column shows a different GAP43-YFP-labeled embryo at representative time-points spanning, from top to bottom, stages 1 to 5. (A-E) Ventrolateral views of a wild-type embryo. (F-J) Lateral views of a wild-type embryo. (K-O) Ventrolateral views of a Tc-cadRNAi embryo. (P-T) Lateral views of a Tc-cadRNAi embryo. In each embryo, cells were tracked from beginning of stage 1, and all panels are timed against this starting point. Cell tracks are color-coded according to stages: stage 1 in yellow, stage 2 in cyan, stage 3 in magenta, stage 4 in red and stage 5 in blue. The corresponding position of cells is indicated with dots, and tracks are displayed up to that time-point. Ventrolateral views show rows of tracked cells across the anterior-posterior axis; at stages 1 to 4, the bottom row (marked with arrows) is very close to the ventral midline; at stage 5, the dotted line outlines the germbands. Lateral views show tracks of leading serosa cells. Please refer to the text for description of cell and tissue movements observed. The fluorescent signal is locally impaired in some embryo regions by autofluorescent and dark blemishes on the vitelline membrane. Average intensity projections, anterior towards the left. Scale bar: 50 μm.

