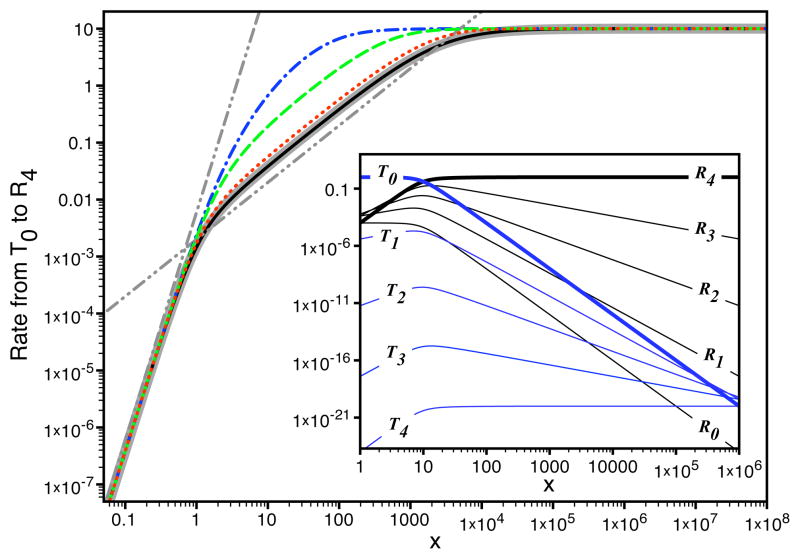
Figure 5.
The approximate (thick gray line) and exact transition rate from state T0 to state R4 in MWC model for c = 10−6 (black solid line), c = 10−4 (red dotted line), c = 10−3 (green dashed line), and c = 10−2 (blue dotted-dashed line). The gray dotted-dotted-dashed and dotted-dotted-dashed-dashed lines are plotted to represent x and x4 behaviors of the transition rate respectively. In the inset, we show the occupancies of all ten states in the MWC model and are given by equation C.4 at c = 10−6. The occupancies of relaxed (tensed) states are shown in black (blue). The thick (thin) lines represent the high (low) occupancy states.

