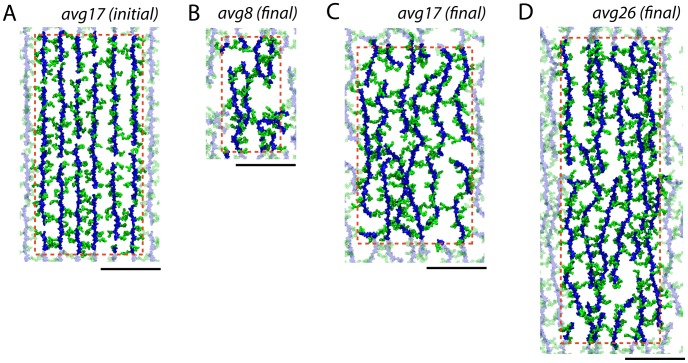
Figure 3. Peptidoglycan patches simulated.
In all parts, glycan strands are in blue and peptides in green. The dotted red line denotes the unit cell boundaries, with the transparent peptidoglycan being periodic copies. The black scale bars below are all equivalent at 10(A) Initially constructed state for avg17 (other patches appeared similarly at this state). (B–D) Final relaxed states for (B) avg8, (C) avg17, and (D) avg26. Inf1 and Inf2 are shown in Fig. S6 in Supporting Information. Relaxation of avg17 is shown in Movie S2.

