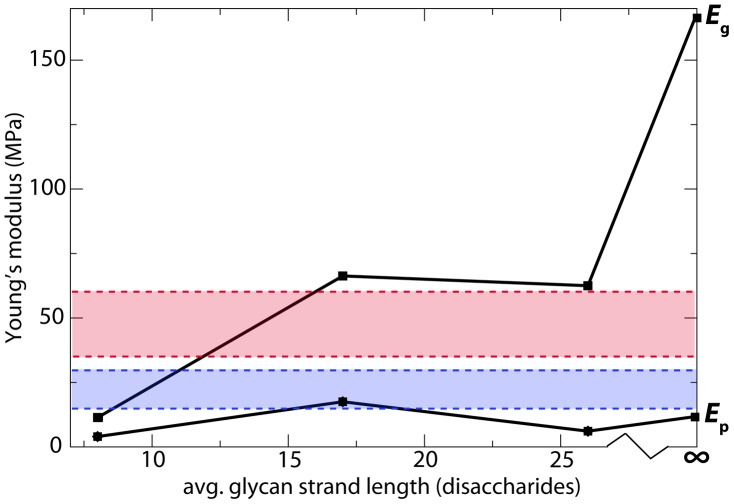
Figure 4. Young's modulus vs. average glycan strand length for the simulated patches.
The elasticity in the glycan-strand direction is labeled  and that in the peptide direction is
  . The red and blue bars represent the range of values measured in AFM experiments for the circumferential and axial cellular directions, respectively [27].

