
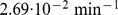
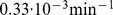
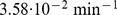
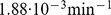
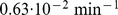
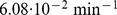
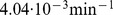
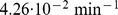
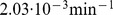
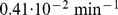
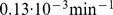
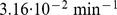
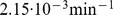
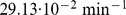
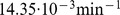
Table 1. Transition rates of the state based model.
| rate | standard deviation | standard deviation [%] | |

|
|
|
1.24 |

|
|
|
5.24 |

|
|

|
5.25 |

|
|
|
6.64 |

|
|
|
4.76 |

|
|
|
3.25 |

|
|
|
6.8 |

|
|
|
4.93 |
The transition rates of the state-based model are given by the phagocytosis rate  of PMN that phagocytose for their first time, the phagocytosis rate
  of PMN that phagocytose for at least the second time, the phagocytosis rate
  of monocytes, the intracellular killing rate
  of monocytes, the intracellular killing rate
  of PMN, the resistance rate
  and the rates that determine the extracellular killing
  and
and  .
.