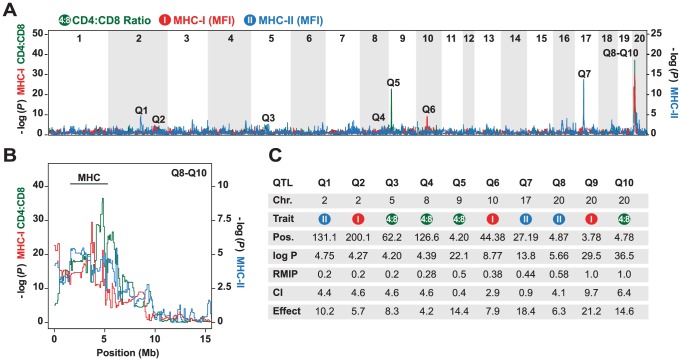
Figure 1. Genetic mapping in heterogeneous stock (HS) rats.
(A) Genome scans of the CD4∶CD8 ratio (green), and the surface expression of MHC class I (MHC-I, red) and MHC class II (MHC-II, blue). The vertical axis shows the negative log P value for the 20 autosomes. Note that the left and right axis show −log P values for different phenotypes. Q1–Q10 indicate significant QTLs. (B) Close-up for Q8–Q10 on chromosome 20 showing the approximate location of the MHC region. (C) Position (in megabases, Mb) of peak marker (Pos.), confidence intervals (CI) in Mb, and effect sizes (%) of the peak markers in the QTLs shown in (A). The RMIP value is a measure of the probability that the loci are correctly identified (max = 1.0).

