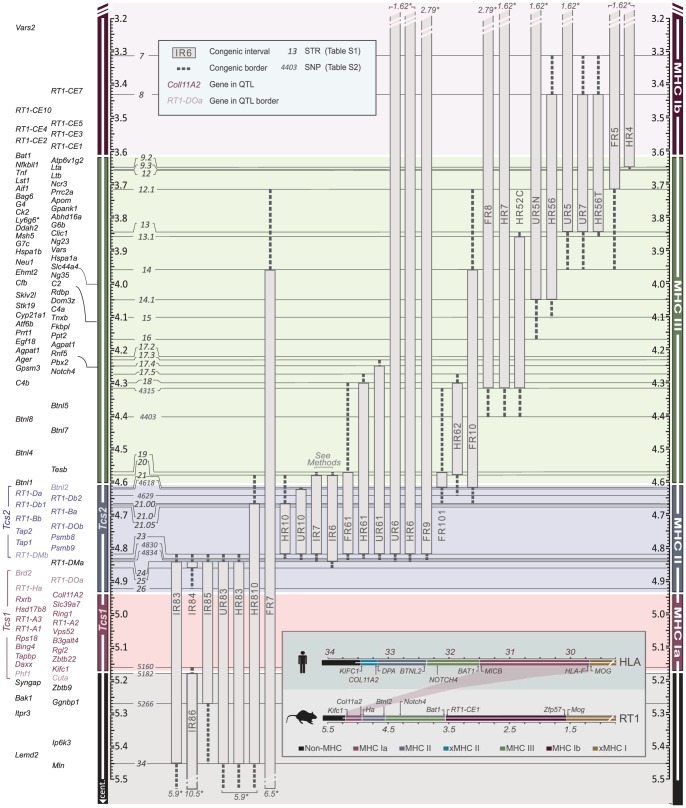
Figure 2. Physical map of the rat MHC region.
The map was constructed according to the NCBI build 3.4 genome assembly. Genes (left) are depicted according to scale (positions in Mb), except for positions indicated with crotchets. The gross organization of MHC-Ia, II, III and Ib -regions are adopted from Hurt et al. [9]. Recombinant congenic strains are shown as gray vertical bars with dashed lines representing congenic borders (intervals of unknown genotype). Markers, short tandem repeats (STRs) and single nucleotide polymorphisms (SNPs), are shown in italic numbers. Numbers with asterisks at the top and bottom of the figure represent the position of the closest negative (DA) marker. Genes in Tcs1 are red and in Tcs2 blue (see box for definitions). Inset shows the organization of the human (HLA) and rat (RT1) MHC regions. Non-recombinant congenic strains, which have fragments spanning the entire MHC region, are not shown. xMHC-II, extended MHC class II region; xMHC-I, extended MHC class I region.

