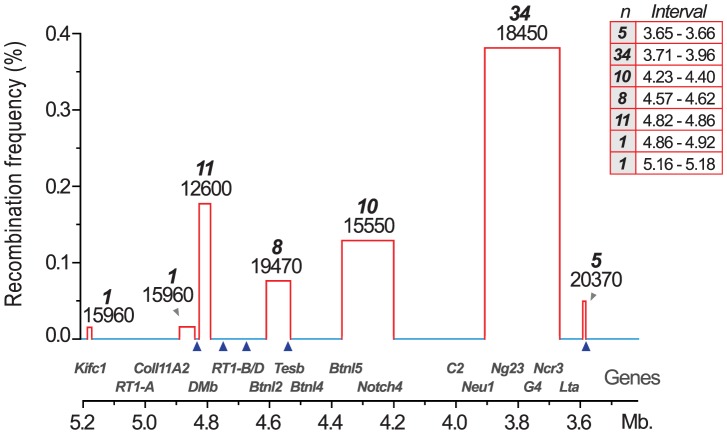
Figure 3. Recombination hotspots and haplotype blocks in the rat MHC.
Recombination activity was assessed over 2(3.4–5.4 Mb). Blue lines represent cold regions (haplotype blocks) with low recombination activity. Regions with recombinations are depicted as red bars. The width of the bars, and the table inset (right), represent recombination intervals. Numbers above bars in bold face represent the observed numbers of recombinations within the interval with the number of analyzed meiotic events shown below. The height of the bars indicate individuals with recombinations (in %). Blue triangles represent recombination hotspots in humans and are adopted from Cullen et al. [6].

