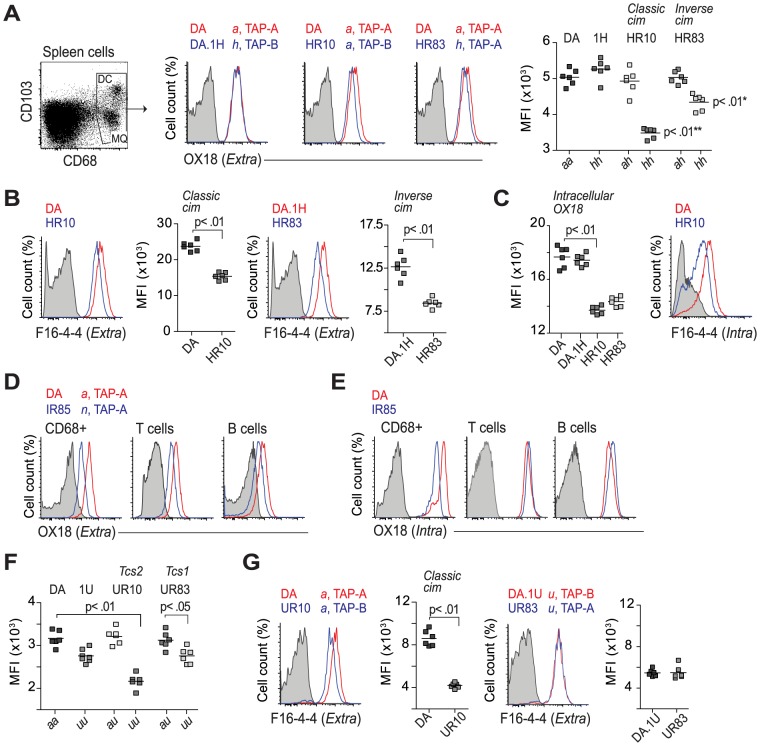
Figure 5. Regulation of class I expression by classical and inverse cim.
(A) CD68+ cells were stained on the cell surface with OX18 (anti-class Ia and Ib). Histograms show representative samples from DA, DA.1H and DA.1H derived strains with different alleles of RT1-A and Tap2 as stated on top. Data from all individuals are shown in scatterplot (far right); * significant compared to DA.1H (1H); ** significant compared to DA. (B) CD68+ cells stained with a class Ia specific antibody (F16-4-4). (C) T cells from animals shown in (A) stained intracellularly with OX18 (scatterplot) and F16-4-4 (histogram). (D–E) Subsets of leukocytes from DA and DA.1IR85 spleen stained extracellularly (D) and intracellularly (E) with OX18. Data are representative of 6 individuals per group. (F) Surface expression of MHC class I (OX18) on CD68+ cells from DA and DA.1U congenic strains. (G) CD68+ cells (same as in F) stained with F16-4-4. Vertical lines in scatterplots show mean values. Representative results of at least two independent experiments are shown.

