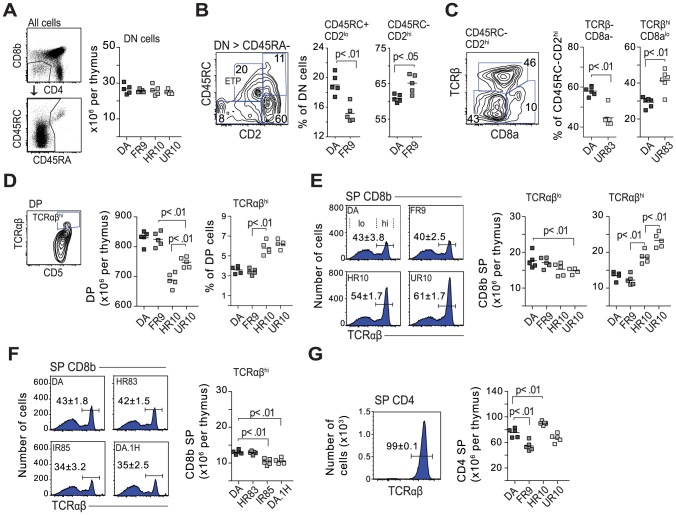
Figure 8. Class-I modification reduces negative selection of CD8 cells.
(A) The QTLs in Tcs1 and Tcs2 did not affect the total number of double negative cells (DN; CD4−, CD8b−). B cells (CD45RA+) were excluded from the DN gate. (B) DN cell maturation is defined by CD45RC and CD2 (see Fig. S10). DN cells in DA.1FR9 showed a lower frequency of early thymic precursors (ETP) compared to DA. Counter plot shows gating strategy with numbers indicating percent (%) of parent population (stated above plot). (C) Counter plot shows CD45RC−, CD2hi DN cells from DA.1UR83, and scatter plots the frequency of TCRβ− and TCRβ+ (DN4 in mouse) cells in DA and DA.1UR83. (D) Thymi from Tcs2-congenic strains with TAP-B (HR10 and UR10) contained fewer double positive (DP) cells but more cells (in %) with high TCR expression. (E) TAP-B strains (HR10 and UR10) showed higher frequencies (histograms) and total numbers (scatter plots) of CD8 single positive (SP) cells with high TCR expression. Numbers (%) in histograms represent mean-values ±SD of cells with high TCR expression (gated, n = 5). (F) Frequencies (histograms; n = 5) and total numbers (scatter plot) of CD8SP cells with high TCR expression in DA.1H (RT1-Ah, TAP-B) and in strains with low levels of surface MHC class I (HR83 [RT1-Ah, TAP-A] and IR85 [RT1-An, TAP-A]). (G) Virtually all CD4SP cells express high levels of TCR. Histogram shows expression of TCR on CD4SP thymocytes in DA (n = 5). Scatterplot shows total number of CD4SP cells per thymus in Tcs2-congenic strains.

