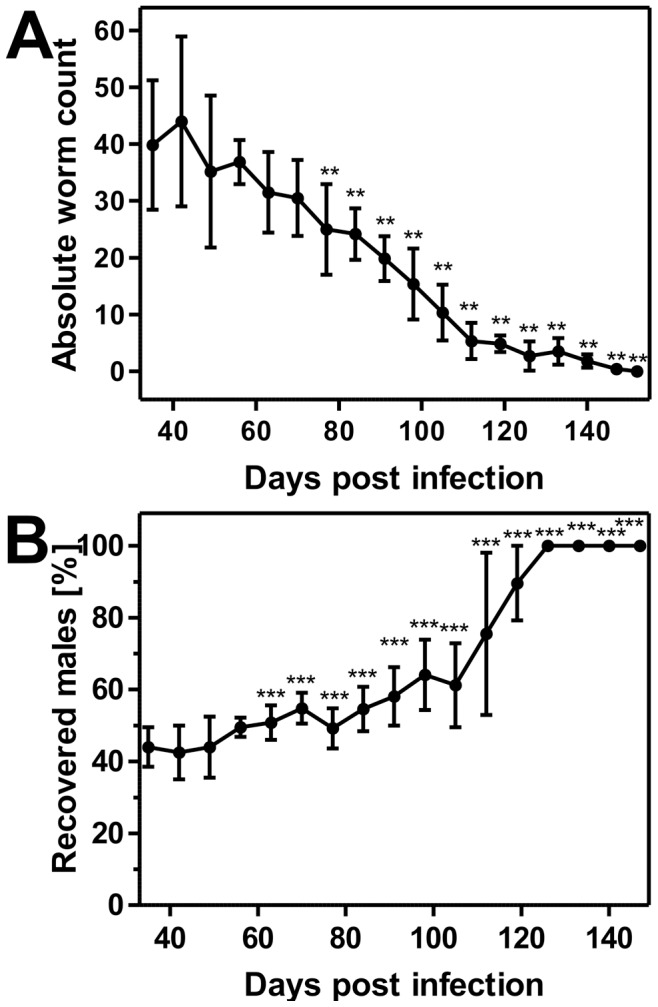
Figure 3. Analysis on the occurrence of T. muris in the course of patency of the infection.

(A) Absolute worm counts in the course of patency of the infection. The graph shows the arithmetic mean values and standard deviations of the absolute number of recovered worms during time with a group size of six animals per time point. Mean worm counts were compared to day 35 p.i. using One-Way-ANOVA followed by Dunnet's post hoc test. **, p<0.01 vs. day 35. (B) Sex ratio of T. muris in the course of patency of the infection. Graph shows the arithmetic means with standard deviations of the recovered male worms expressed as percentage of total recovered worms with a group size of six animals per time point. ***, p<0.001 vs. day 35.
