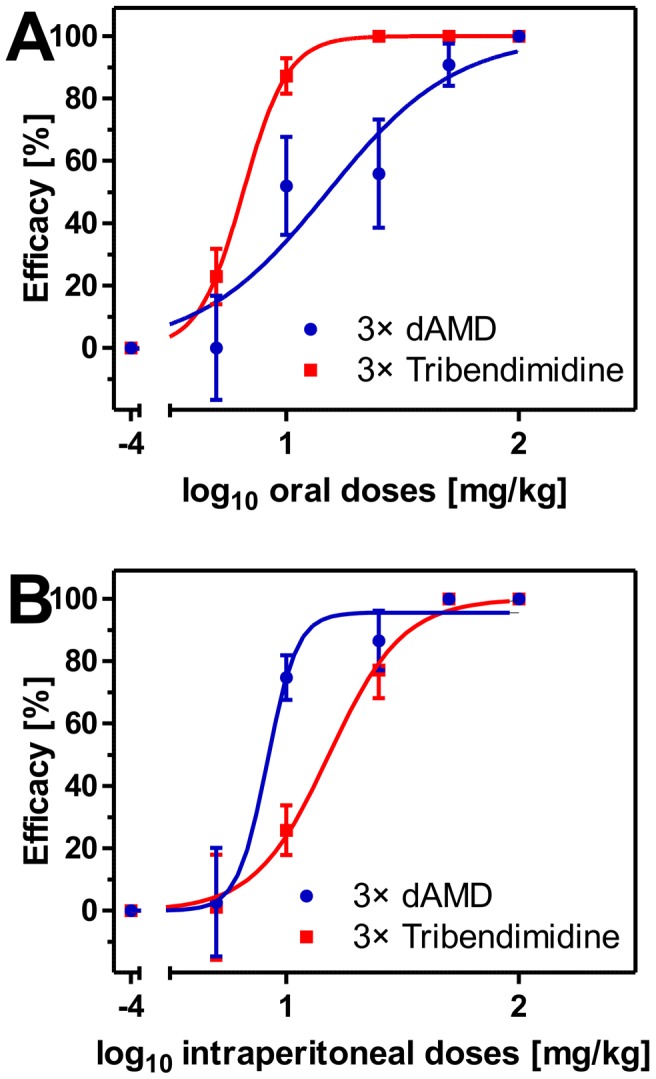
Figure 4. In vivo dose-response curves of dAMD (blue) and tribendimidine (red) after oral (A) and intraperitoneal (B) treatments against mature adults of T. muris.

Dose-response curves show the arithmetic mean values and standard errors of the mean with a group size of five animals per drug and dose. Efficacy was calculated as relative number of recovered worms compared to the no-drug control in percentage. Dosages were log10 transformed and logistic regressions were calculated with top values constrained between 0 and 100%. Efficacies were set to zero if mean of the worm counts was higher than the mean of the corresponding control group. Furthermore, the corresponding SEM values of the affected groups start from zero. The no-drug controls were set to 10−4 mg/kg to allow log10 transformation of dosages.
