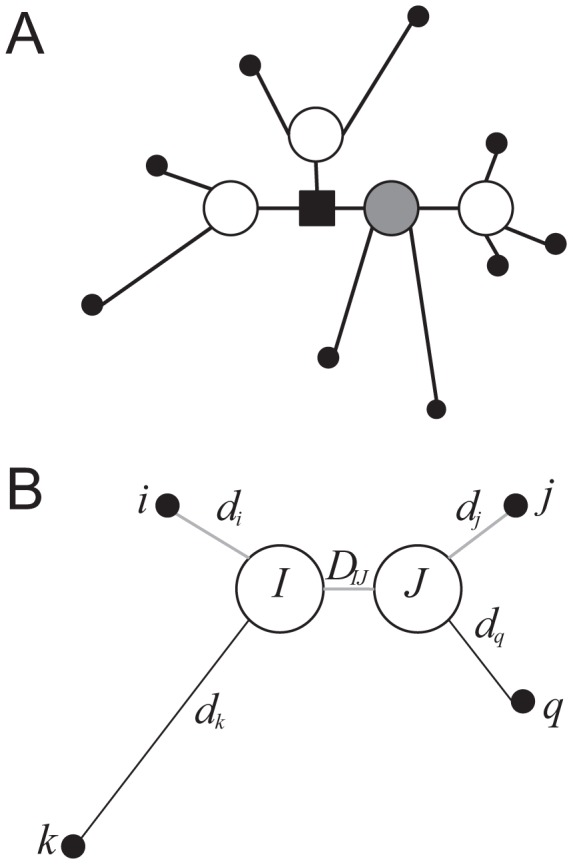
Figure 1. A) Graph illustrating the AMOVA modelling of the genetic relationships of individuals.

Each individual, coloured as black vertex, connects to a vertex of type population, which can be either a non-admixed population if it is connected to a single group vertex (black square) or an admixed population if the population vertex is connected to more than one population/group. B) A simple two-population model. The vertex group between the two populations has been removed for clarity. The distance of each specimen to its own population (d.) can be larger than the distance between populations (DIJ) to the extent, that based on distances between individuals (Dij), individual k would be a single node and individual i would be clustered with individuals j and q.
