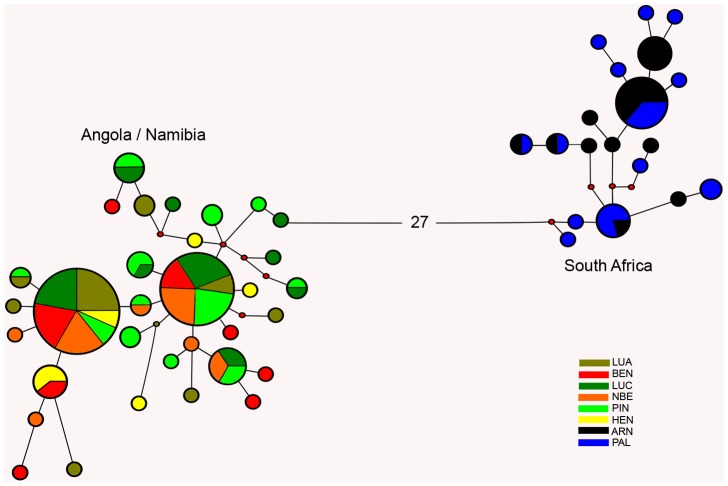
Figure 3. Haplotype network for A. aequidens sampled across the Benguela region.
Haplotype network based on 583 bp of mtDNA CR sequences. Node sizes are proportional to number of individuals observed for that haplotype and colour codes refer to sampling site (see Table 1 for site designations). Red dots correspond to missing (non-sampled) haplotypes.

