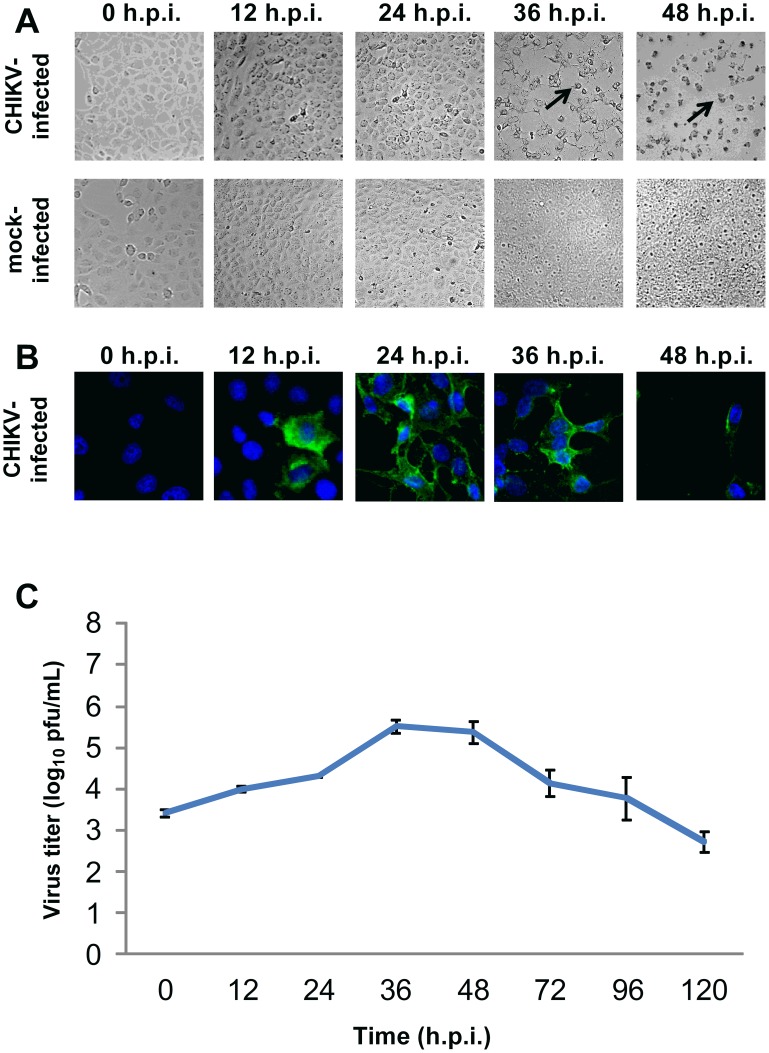
Figure 2. Growth kinetics of CHIKV in Vero C1008 at an MOI of 10.
(A) CHIKV-infected Vero C1008 cells were viewed under DIC microscopy to observe for any morphological changes. Extensive CPE was observed from 36 h.p.i. onwards, as shown by the spindle-shaped and round appearance of cells (black arrows). (B) CHIKV-infected Vero C1008 cells were fixed at various intervals post-infection and immunofluorescence assay was performed to detect for CHIKV protein expression (green). Cell nuclei were stained with DAPI (blue). High amounts of CHIKV protein expression was observed at 24 and 36 h.p.i. of Vero C1008. (C) Quantification of infectious virus titer by plaque assay showed an increasing trend, with a peak in infectious virus titer at 42 h.p.i.. Vertical bars represent one standard deviation from the mean of three readings.

