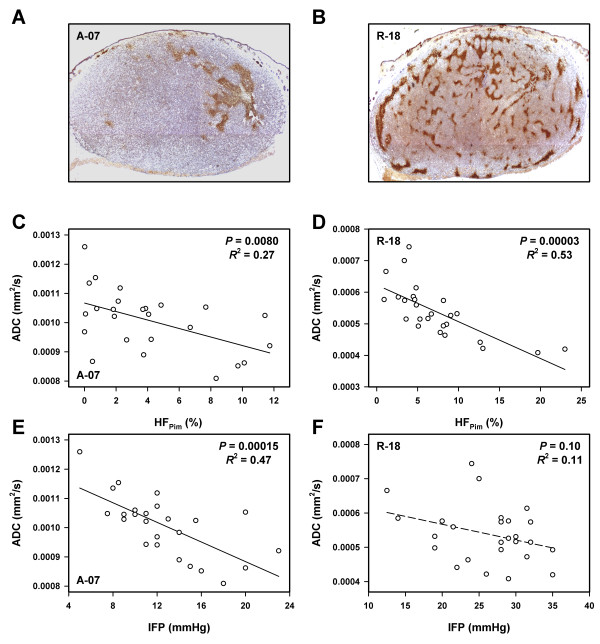
Figure 4.
DW-MRI, hypoxia, and IFP data for A-07 and R-18 melanoma xenografts showing that ADC decreased with increasing HFPim and increasing IFP. Histological sections of a representative A-07 tumor (A) and a representative R-18 tumor (B) stained with anti-pimonidazole antibody to visualize hypoxic tissue, plots of median ADC versus HFPim for A-07 (C) and R-18 (D) tumors, and plots of median ADC versus IFP for A-07 (E) and R-18 (F) tumors. Points represent single tumors. Curves were fitted to data by regression analysis.

