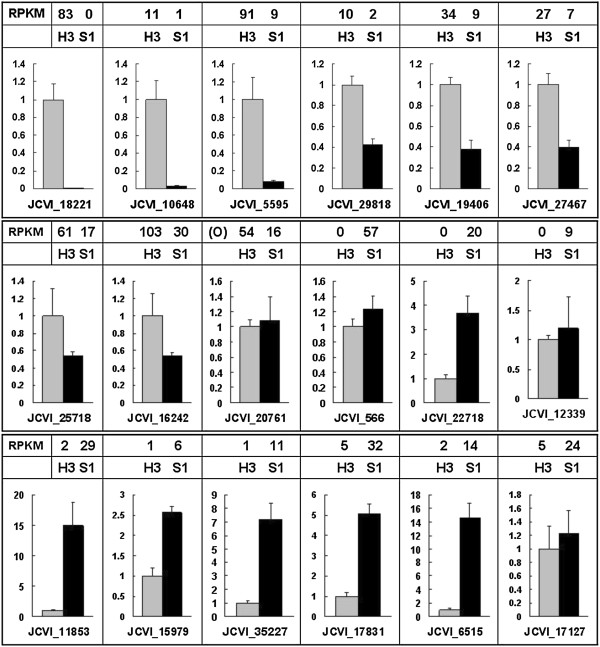
Figure 6.
RT-PCR confirmation of the differentially expressed genes between H3 (gray columns) and S1 (black columns). Columns and bars represent the means and standard error (n = 3), respectively. The gene expression levels from RNA-Seq data are added on the top of each gene. RPKM: Reads Per Kb per Million reads, O: the change trend of gene expression is the opposite to the result of RNA-Seq.

