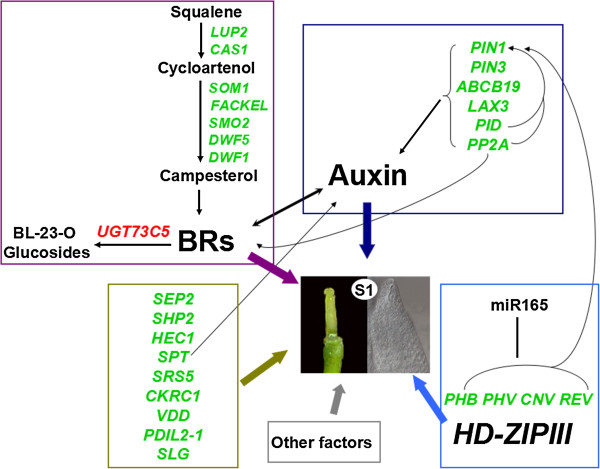
Figure 7.
A proposed model of BR-, auxin-, and HD-ZipIII genes-dependent pathways for gynoecium development. All genes displayed in this figure correspond to DEGs in this study, other related genes without difference are not showed here. Genes with green color are down-regulated and those with red color are up-regulated in S1 pistils. Different colors of rectangle represent different pathway or factors, purple: BRs synthesis and metabolism, dark blue: polar auxin transport, light blue: HD-ZipIII genes, deep yellow: other related genes. Arrows and bars indicate positive and negative regulatory interactions, respectively. BRs: Brassinosteroids. This figure also includes the information from other sources [3,14,37].

