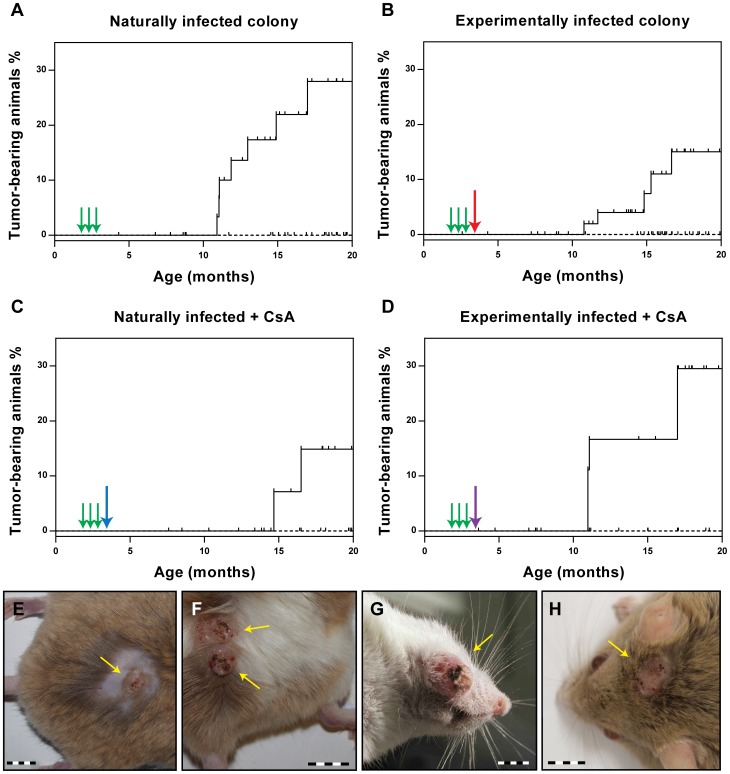
Figure 4. Incidence of virus-induced tumors.
Immunocompetent and immunosuppressed animals were monitored over a period of 20 months for the occurrence of skin tumors (for number of animals, see Table 1). The Kaplan-Meier plots (Panels A–D) show the tumor incidence for each group in vaccinated (dashed line) and control animals (full line). Tumor-bearing animals displayed 1–4 skin tumors each (mean = 1.4). Green arrows indicate the time points of vaccination. The red arrow indicates the time of experimental infection, the blue arrow the start of the CsA feed, the purple arrow of both. The small vertical bars indicate censored animals which died for unknown reasons before tumor development. Differences between vaccinated and control animals were evaluated using the log rank test. The number of animals is given in Table 1. Panels E/F: Papillomas and keratoacanthomas in the lower back (infection site) of control animals from the experimentally infected colony. Panels G/H: Papillomas and keratoacanthomas arising in control animals from the naturally infected colony. Bars: 1 cm.

