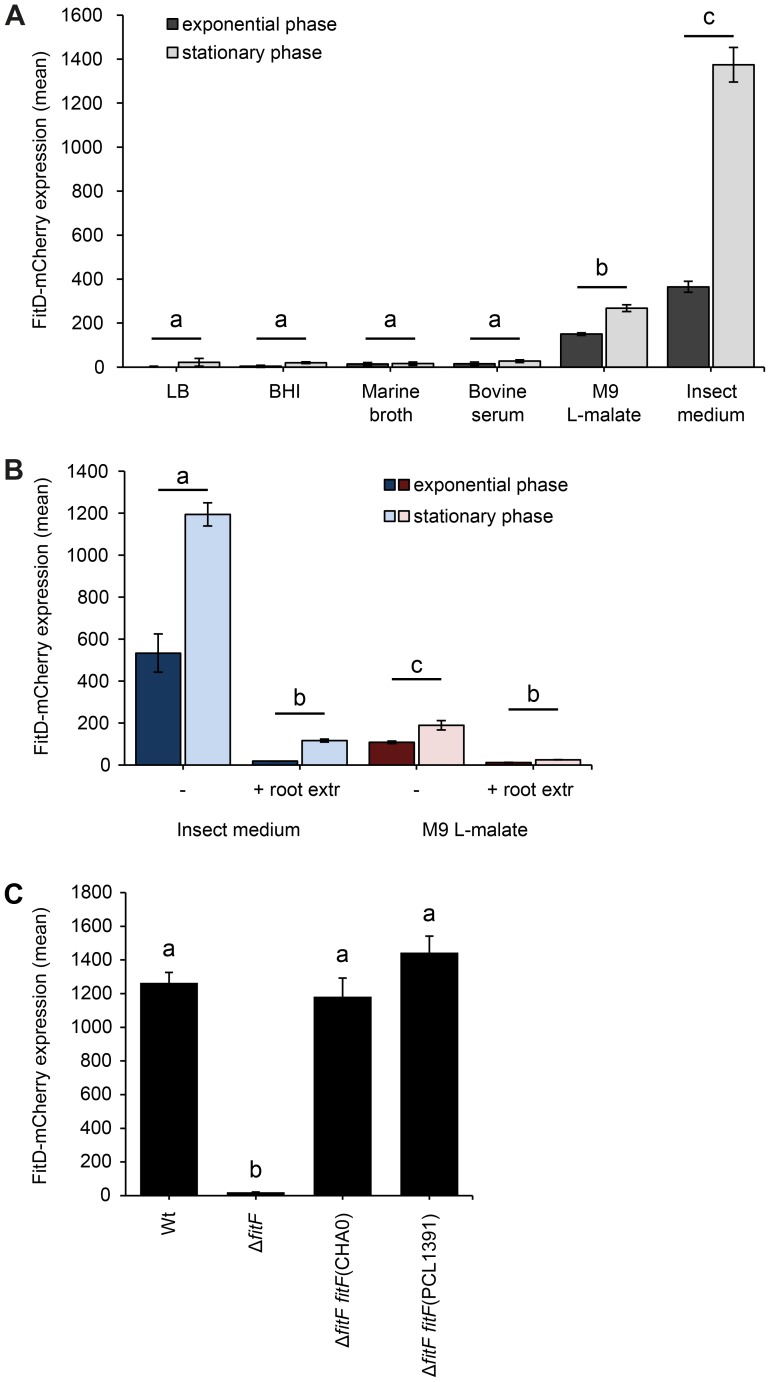
Figure 2. Expression of the Fit insect toxin can be induced in an insect hemolymph-mimicking medium (GIM).
(A) The FitD-mCherry reporter strain of P. protegens CHA0 (CHA1163) was grown in different media and red fluorescence intensities of single cells were quantified by epifluorescence microscopy in the exponential (8 h post inoculation) and stationary (24 h post inoculation) growth phase. Results are the mean and standard deviation of population averages of single cell fluorescence intensities from three independent cultures (n = on average approx. 3200 cells per treatment and time point). Treatments labeled with a different letter are significantly different (p-values<0.0001; two-way ANOVA with Tukey's HSD test for post-hoc comparisons). The experiment was performed three times with similar results. (B) Quantification of the expression of FitD-mCherry in the wild-type background of CHA0 (CHA1163) in GIM and M9 L-malate with or without root extracts from field-grown wheat (n = on average approx. 2600 cells per treatment and time point). Characters indicate significant differences between the treatments (p-values<0.05; two-way ANOVA with Tukey's HSD test for post-hoc comparisons). The experiment was repeated twice with similar results. (C) Quantification of the expression of FitD-mCherry in the wild-type (CHA1163) and ΔfitF deletion mutant (CHA1174) background of strain CHA0 grown in GIM for 24 h at 25°C (n = 2768–3239 cells per strain). Re-introducing a single copy of fitF from CHA0 (CHA5066) or PCL1391 (CHA5073) in the bacterial chromosome rescued the expression of FitD-mCherry. Means labeled with a different letter are significantly different (p-value<0.05; one-way ANOVA with Tukey's HSD test for post-hoc comparisons). The experiment was performed three times with similar results.

