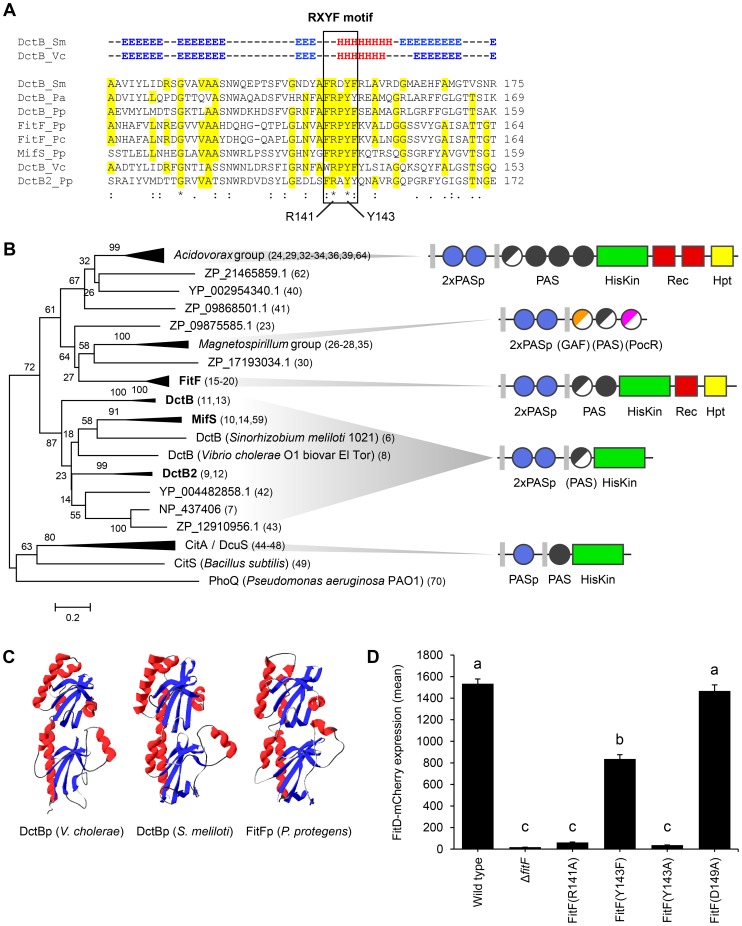
Figure 3. FitFp is homologous to the periplasmic DctB-like sensor domain.
(A) Multiple sequence alignment of the periplasmic region of FitF and DctB homologs (selection). Amino acid residues that are identical to FitF are highlighted in yellow. Secondary structures of DctB were deduced from the corresponding crystal structures and are displayed on top (H, alpha helix; E, beta sheet; -, coil). Pa, P. aeruginosa PAO1; Pp, P. protegens CHA0; Pc, P. chlororaphis PCL1391; Sm, S. meliloti; Vc, V. cholerae. (B) Phylogenetic tree with sequences obtained from BLASTp searches using the periplasmic sequence of FitF of P. protegens CHA0 and of homologs of DctBp. MAFFT was used for sequence alignment and the Minimum Evolution method in MEGA [44] for inferring the evolutionary history of the proteins. The percentage of replicate trees in which the associated proteins clustered together in the bootstrap test (500 replicates) is shown next to the branches. Evolutionary distances, which were computed using the Poisson correction method, are drawn to scale and are in the units of the number of amino acid substitutions per site. The corresponding protein sequences can be found in File S1. The predicted domain topology of the entire proteins is depicted for groups of interest. Domains that are displayed in half do not exist in all proteins of the respective group. PhoQ was used as out group. (C) Tertiary structure prediction for P. protegens FitFp by Phyre2 in comparison with crystal structures of DctBp of V. cholerae (PDB code 3BY9) and S. meliloti (PDB code 3E4O). Other modeling programs predicted highly similar structures (data not shown). (D) Site-directed mutagenesis of the native fitF gene in the FitD-mCherry reporter strain CHA1163. The sites of the mutated residues are depicted in panel A and Figure 1C. Microscopic quantification of the expression of FitD-mCherry in the wild-type and individual mutant backgrounds of CHA0 grown for 24 h in GIM. Results are the mean and standard deviation of population averages of single cell fluorescence intensities from three independent cultures (n = on average approx. 2900 cells per strain). Characters indicate significant differences between the means (p-values<0.01; one-way ANOVA with Tukey's HSD test for post-hoc comparisons). The experiment was performed three times with similar results.

