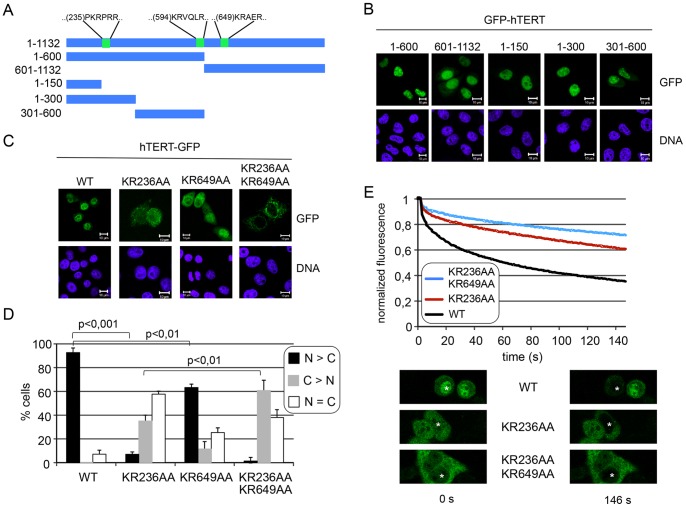
Figure 1. Analysis of potential NLSs in hTERT.
A, schematic representation of GFP-tagged full-length hTERT and hTERT fragments used in this study. Putative NLSs are indicated. B, hTERT-fragments accumulate in the nucleus. HeLa cells were transfected with hTERT constructs as indicated, fixed and analyzed by confocal microscopy. C, HeLa cells were transfected with constructs coding for full-length hTERT-GFP or putative NLS-mutants, as indicated and analyzed by confocal microscopy. B, C, bars, 10 µm. D, Quantification of the results in C. Error bars show the standard deviation from the mean of three independent experiments. E, Nuclear import of wild type, GFP-tagged hTERT and two NLS-mutants was analyzed by FLIP in living cells. Cells with similar expression levels were chosen for the analysis. Examples for individual cells before and after the analysis are shown at the bottom. Asterisks depict the bleached nuclear region. The graphs (top) show the mean loss in fluorescence in three independent experiments, analyzing a total of 45 cells per condition. Error bars were omitted for clarity (see Fig. S1 for an example of a FLIP-experiment with error bars).

