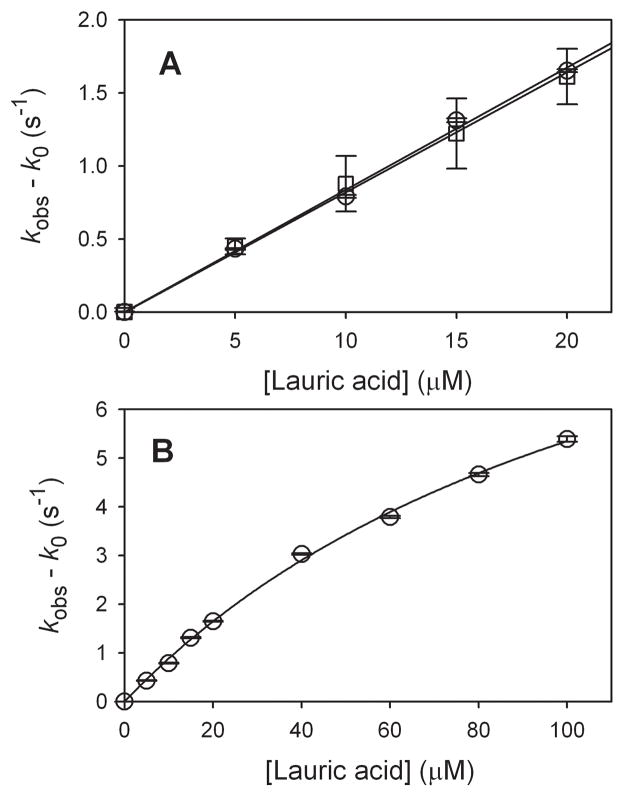
Figure 5.
Kinetic results at for oxidations of lauric acid at −5 °C in 100 mM phosphate buffer (pH 7.0) containing 50% glycerol. (A) Comparison of MCPBA oxidations (circles) and photooxidations (squares) at low lauric acid concentrations. (B) Results from MCPBA oxidations at high concentrations. Error bars are at 1σ. The lines are the fits for apparent second-order rate constants in A or for the saturateion kinetic parameters in the text in B.

