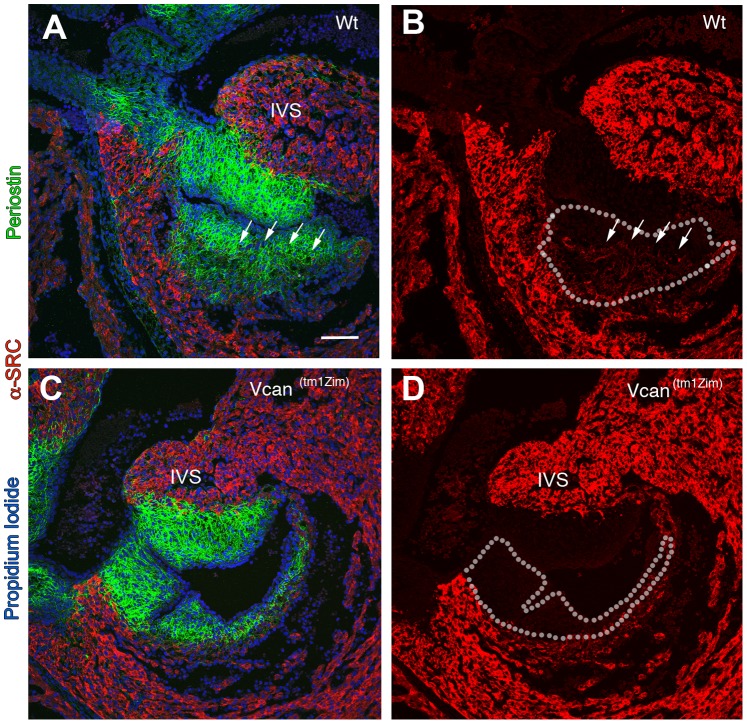
Figure 11. Restricted or delayed process of myocardialization observed in the Vcan (tm1Zim) hearts.
E13.5 pc wild-type hearts (A, B) compared to Vcan (tm1Zim) (C, D). The image in each panel is one taken from sections through the right parietal cushions at their thickest margin. Panels A and C utilize both periostin staining (green) and α-sarcomeric actin (red) to mark the cushion and muscle boundaries (propidium iodide marks the cell nuclei in blue). Panels B and D are the same image as A and C with periostin and propidium iodide staining removed to show the extent of muscle cells (α-sarcomeric actin positive) present within the cushion more clearly (A & B; arrows mark the muscle boundary; dotted lines mark the boundaries of the cushion). The WT hearts show that muscle cells are present in the cushion. The Vcan (tm1Zim) hearts show little or no presence of muscle into the adjacent matrix of the phenotypically smaller cushions of the Vcan (tm1Zim) hearts (B, C). IVS-interventricular septum. Magnification bar in panel A = 100 µm and applies to all panels.

