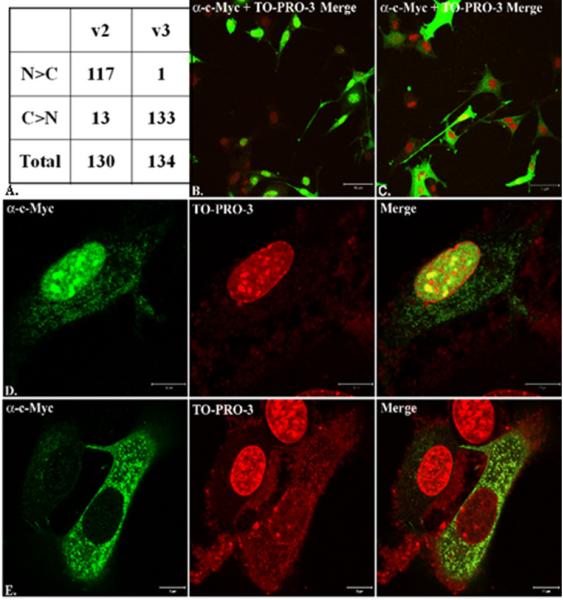
Figure 3.
Localization of mouse v2 (nucleus) and v3 (non-nuclear) by immunofluorescence using confocal microscopy. In (A), 130 NLT cells transfected with v2 and 134 cells transfected with v3 were quantified as being predominantly nuclear (N>C) or predominantly cytoplasmic (C>N). N = nuclear; C = cytoplasmic. Low 10X power views of v2 (B) and v3 (B) demonstrate cellular distribution. In addition, high power (40X) images of v2 (D) and v3 (E) are shown with c-Myc expression (indicating NELF), nuclear expression (TO-PRO-3), and merged images.

