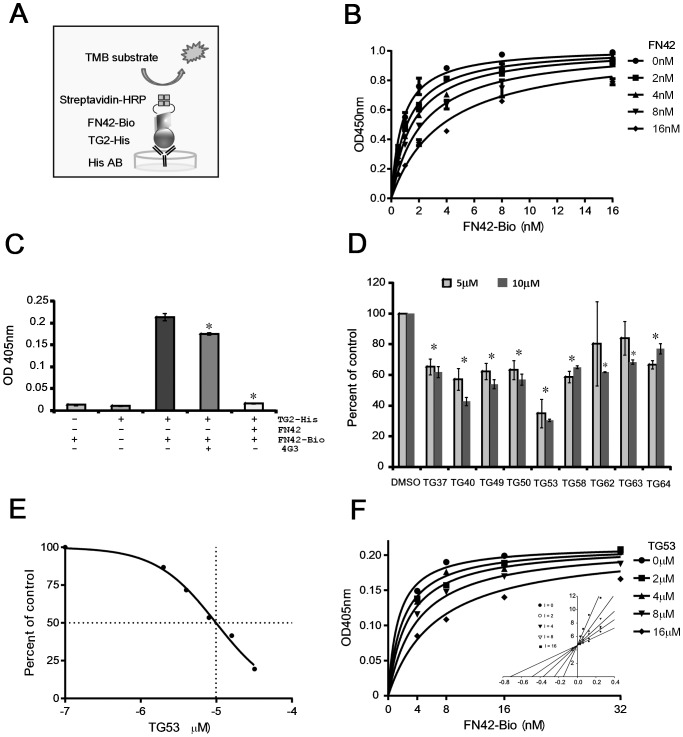
Figure 3. ELISA-based approach measures the TG2-FN interaction.
A, Design of the ELISA measuring the TG2-FN interaction. His tagged TG2 is captured by the anti-His antibody coating the wells. Biotinylated FN42 interacting with TG2 is recognized by streptavidin-HRP, which reacts with a TMB substrate. The signal is abrogated if the TG2-FN interaction is disrupted. B, Specificity of the assay is demonstrated by incubating His-tagged TG2 with increasing concentrations of biotinylated FN42 (from 0 nM to 16 nM) in the presence of unlabeled FN42 (from 0 nM to 16 nM). C, ELISA in the presence of the competitive inhibitor 4G3, an anti-TG2 antibody against the FN-binding domain of TG2 (5 μg/ml), and in the presence of unlabeled FN42 (3 nM). D, ELISA measures inhibition of the TG2-FN42 interaction by SMIs selected from the AlphaLISA HTS. Bars represent means +/− SD of triplicate measurements. Asterisks denote p <0.05. E, ELISA measures dose dependent inhibition of TG2-FN42 interaction by TG53. F, Saturation curves of FN42 in the presence of increasing concentrations of TG53 were used to calculate the Ki (4.15 μM) of TG53 for TG2. Inset corresponds to representative Lineweaver-Burk plots showing that TG53 competes for the same binding site in TG2 as FN42.

