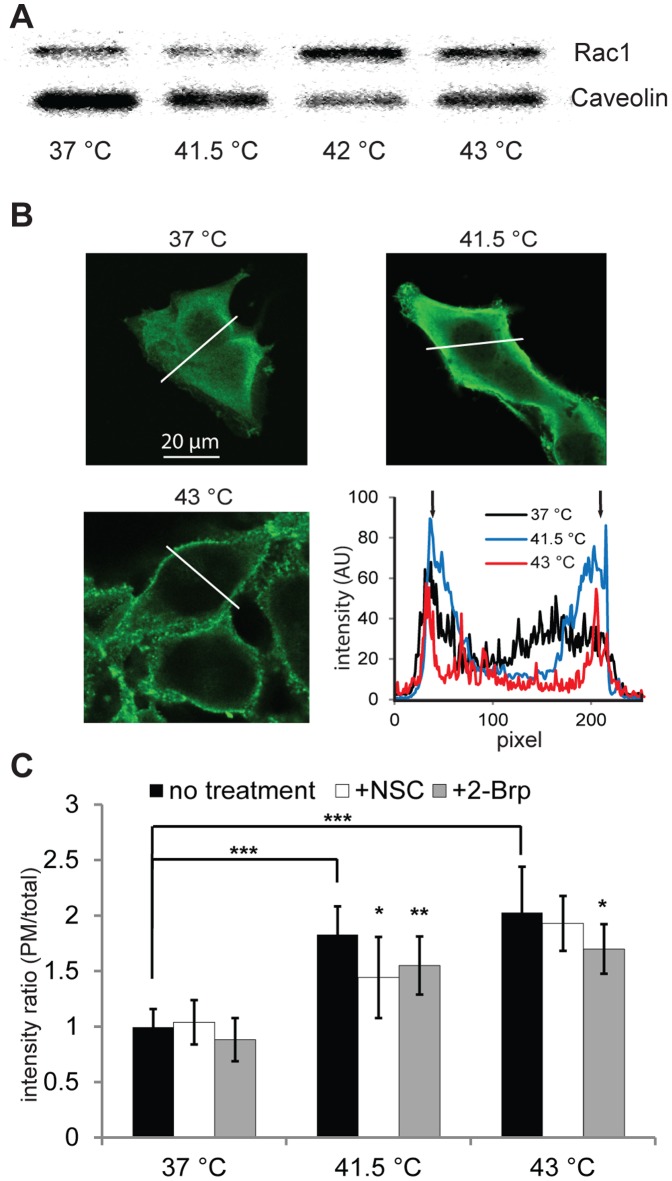
Figure 1. Translocation of Rac1 to membranes as a result of Rac1 inhibitor and heat shock treatment.
(A) Localization of Rac1 to the crude membrane fraction in response to heat shock treatment. B16F10 cells were subjected to heat shock at the indicated temperatures for 1 h. Immediately after this, the crude membrane fraction was isolated and solubilized in Laemmli buffer. Equal amounts of proteins were run for western blotting. Rac1 probing was performed for the membrane, and caveolin immunostaining was used for normalization. Changes in normalized Rac1 band intensities: 37°C = 100, 41.5°C = 132, 42°C = 310, 43°C = 255. (B) Visualization of the association of Rac1 to the PM. B16F10 cells in glass-bottomed plates were kept in a water bath at the indicated temperatures for 1 h. The cells were then fixed, permeabilized and immunoreacted with Rac1 mAb, and probed with Alexa488-labeled secondary antibody by confocal microscopy. Intensity profiles of regions of interest on confocal images (indicated with white lines) are shown. Black arrows indicate PM. The red curve refers to 43°C, the blue curve to 41.5°C and the black curve to 37°C. (C) The effects of Rac1 inhibitor administration on the PM binding of Rac1 under heat stress conditions. Cells were treated/or not with the Rac1 inhibitor NSC or 2-Brp, heat-shocked/or not, and then immunostained as above. Confocal images were taken and 15 cells/3 views for each treatment were quantified by ImageJ. The bars represent the fluorescence intensity of the PM versus the fluorescence intensity of the whole cell. Black bars relate to cells not treated with inhibitor, white bars to NSC-treated and gray bars to 2-Brp-treated cells. Data are means ± SEM, n = 3, Student’s t-test was used for statistical analysis. *: p<0.05; **: p<0.01; ***: p<0.001.

