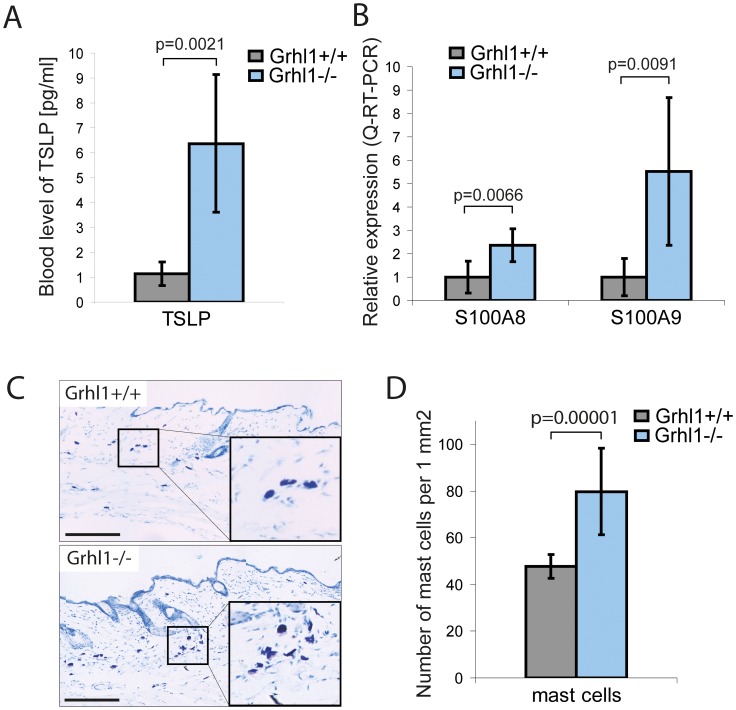
Figure 2. Skin inflammation in Grhl1 −/− mice.
(A) Blood levels of TSLP in Grhl1 +/+ (gray bar) and Grhl1 −/− mice (blue bar), measured with ELISA kit. (B) Levels of expression of antimicrobial peptides S100A8 and S100A9 in the epidermis of Grhl1 +/+ (gray bar) and Grhl1 −/− mice (blue bar), measured with Q-RT-PCR. (C) Representative skin sections of Grhl1 +/+ (top panel) and Grhl1 −/− mice (bottom panel) stained with toluidine blue to visualize dermal mast cells (purple cells). Scale bars represent 200 µm. (D) Quantification of skin infiltration with mast cells for Grhl1 +/+ (gray bar) and Grhl1 −/− mice (blue bar), estimated as numbers of stained cells per 1 mm2 area of 10 µm thick skin section (using ImageJ software). (A, B, D) Significance (Student’s t-test, p-value) is shown above bars.

