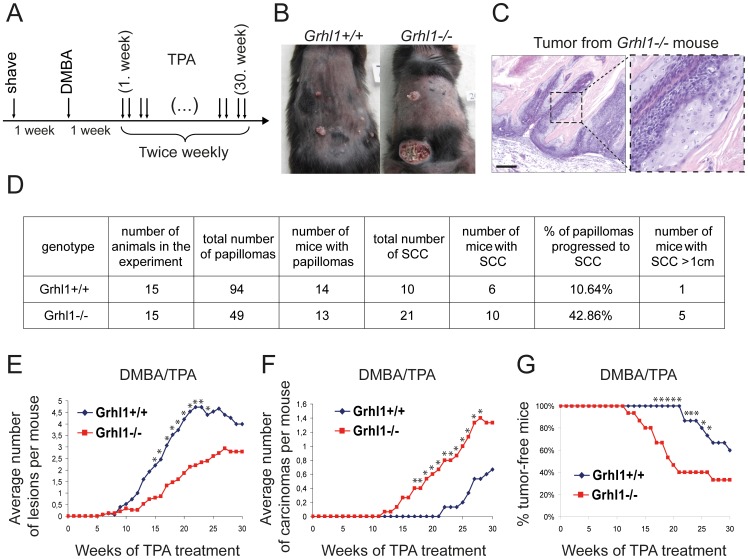
Figure 3. Skin carcinogenesis in Grhl1 −/− and control mice.
(A) Timeline of DMBA/TPA treatment in two-stage chemically-induced skin tumor development protocol. (B) Representative Grhl1 −/− and Grhl1 +/+ mice after 30 weeks of TPA treatment. (C) Hematoxylin and eosin staining of a representative SCC tumor from a Grhl1 −/− mouse at low (left panel) and high magnification (right panel); scale bar represents 200 µm. (D) Summary of the results. (E–F) Average number of: (E) papillomas; (F) squamous cell tumors; (G) Kaplan-Meier analysis presenting tumor free mice in relation to the time of experiment. Grhl1 −/− – red lines; Grhl1 +/+ – blue lines. Asterisks indicate time points at which differences between the two groups of animals were statistically significant (p<0.05).

